WinChart Technical Analysis
Daily Market analysis
| We
are an approved Securities Industry Development Corporation (SIDC)-CPE Training Provider. the training and development arm of the Securities Commission Malaysia (SC). |
|||
 |
 |
||
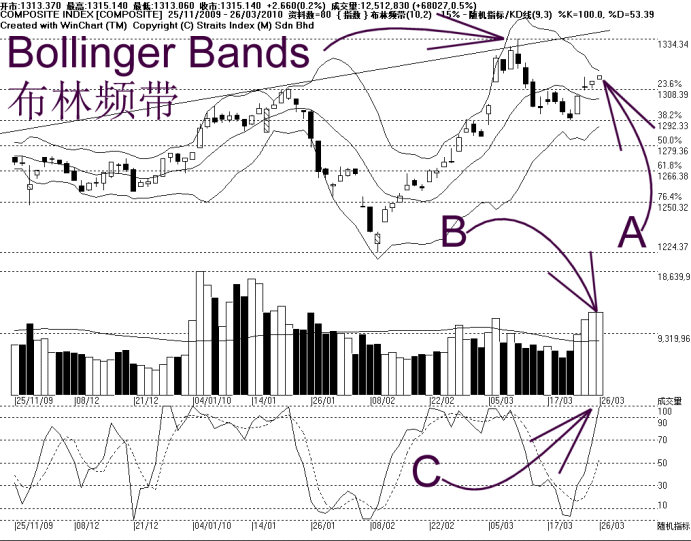
As indicated by A, the FBMACE tested the 14, 21, 31 EMA on Friday, but remains resisted by the 14, 21, 31 EMA. Therefore, it is still serving as the dynamic resistance to the FBMACE, thus the immediate technical outlook for the FBMACE is still on the negative side.
Support for the FBMACE is still at 4180 WinChart Automatic Fibonacci Retracement while the resistance is at 4296 WinChart Automatic Fibonacci Retracement. Meanwhile, the Bollinger Bands contracted 7%, suggesting that the FBMACE is still consolidating.
As circled at B, the Stochastic is still above 70%, which suggesting that the short term movement of the FBMACE is still bullish biased. Technically, the short term bullishness shall remain intact until the Stochastic should break below 70% level.
As circled at C, the MACD histogram is still rising, suggesting that the short term movement of the FBMACE is still picking up strength, this improvement shall carry on until the MACD histogram forms a Rounding Top. However, with the MACD line still below the zero level, this shows that the mid to longer term of the FBMACE is still weak.
In conclusion, despite positive signals from Secondary Indicators, the immediate outlook for the FBMACE is still on the negative side, unless the FBMACE could break above the 14, 21, 31 EMA successfully.
Find this analysis useful? Why not share it with others? Click Here to send this to a friend
 1st Online Training In Malaysia |
 |
 |
 |
| View the Online Training | More Market Analysis | Find out more about WinChart | Upcoming Events |
Straits Index (M)
Sdn Bhd
No. 16, Jalan LP 1A / 5, Lestari Perdana,
43300 Seri Kembangan, Selangor
Hotline: (03) 8941 6828 (5
lines) Fax: (03) 8941 9828
Email: info@straitsindex.com
© Copyright 1997-2010 Straits Index (M) Sdn Bhd All
rights reserved