WinChart Technical Analysis
Daily Market analysis
| We
are an approved Securities Industry Development Corporation (SIDC)-CPE Training Provider. the training and development arm of the Securities Commission Malaysia (SC). |
|||
 |
 |
||
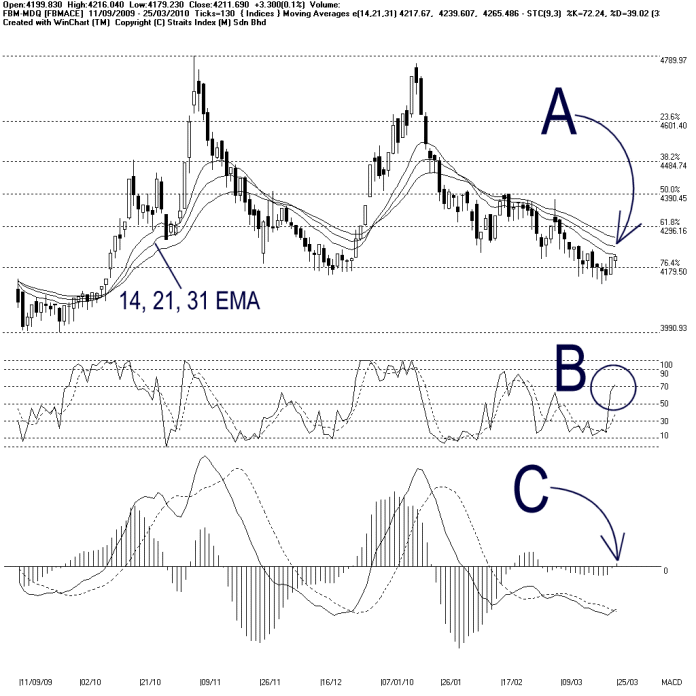
As indicated by A, the FBMACE continued its technical rebound on Thursday, gaining 3.3 points or 0.1%. However, the FBMACE is now precisely resisted by the 14-day Exponential Moving Average, which suggests that the 14, 21, 31 EMA is still serving as the dynamic resistance for the FBMACE, hence the technical outlook remains bearish biased.
As shown on the chart above, support for the FBMACE remains at 4180 WinChart Automatic Fibonacci Retracement while the resistance other than the 14, 21, 31 EMA would be the 4296 WinChart Automatic Fibonacci Retracement.
As circled at B, the Stochastic is still rising, and tested the 70% level. This suggests that the FBMACE is still having its technical rebound. If the Stochastic should remain above 70% level, the short term market movement for the FBMACE is expected to improve further.
As indicated by C, the MACD histogram is still rising, and breaking above the zero level. Therefore, this implies that the FBMACE is gradually gaining strength, and the improvement of the FBMACE is expected to carry on until the MACD histogram should form a Rounding Top.
Despite improving signals from the Secondary indicators, the FBMACE is still testing the 14, 21, 31 EMA, thus suggesting that the current rebound is only a technical rebound. However, do keep in mind that all uptrend started with a technical rebound, and therefore, it pays to monitor if the FBMACE would break above the 14, 21, 31 EMA and later forms a higher-low, which is a characteristic of an uptrend.
Find this analysis useful? Why not share it with others? Click Here to send this to a friend
 1st Online Training In Malaysia |
 |
 |
 |
| View the Online Training | More Market Analysis | Find out more about WinChart | Upcoming Events |
Straits Index (M)
Sdn Bhd
No. 16, Jalan LP 1A / 5, Lestari Perdana,
43300 Seri Kembangan, Selangor
Hotline: (03) 8941 6828 (5
lines) Fax: (03) 8941 9828
Email: info@straitsindex.com
© Copyright 1997-2010 Straits Index (M) Sdn Bhd All
rights reserved