WinChart Technical Analysis
Daily Market analysis
| We
are an approved Securities Industry Development Corporation (SIDC)-CPE Training Provider. the training and development arm of the Securities Commission Malaysia (SC). |
|||
 |
 |
||
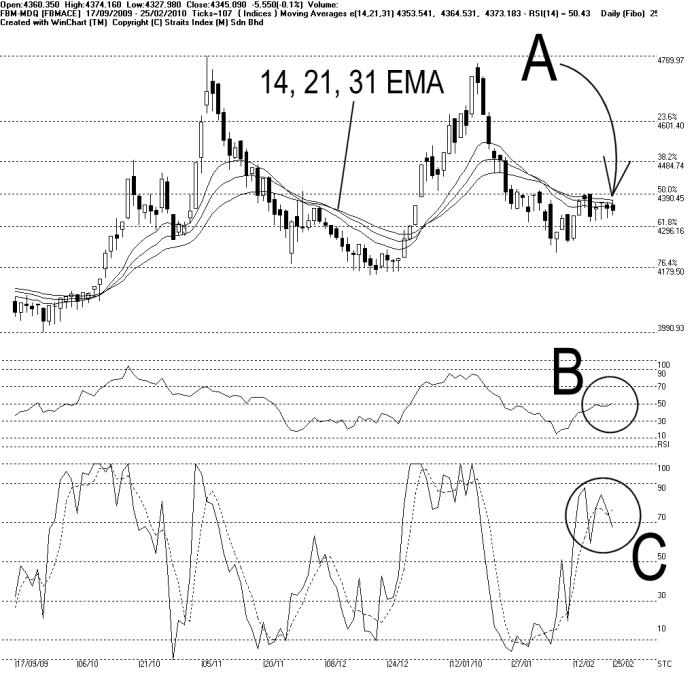
On Thursday, the FBMACE continued to move sideways, ended 5.55 points or 0.1% lower. As indicated by A, the FBMACE is still resisted by the 14, 21, 31 EMA, thus it has not broken away from its consolidation.
Meanwhile, the Bollinger Bands contracted again, suggesting that the FBMACE is still consolidating. Nevertheless, resistance for the FBMACE remains at 4390 WinChart Automatic Fibonacci Retracement while the support is at 4296 WinChart Automatic Fibonacci Retracement.
As circled at B, the WinChart RSI is still testing the 50% level, suggesting that the mid term market movement is trendless. This is typical for the FBMACE is still moving in a narrow sideways movement.
As circled at C, the Stochastic breaks below 70% level marginally, suggesting that the short term movement of the FBMACE is about to turn weaker. Unless, the Stochastic could return to above 70% level in the immediate term, the short term bullish signal is now ended.
In short, despite improvement technical signals for the past few days, the FBMACE failed to break away from the 14, 21, 31 EMA. Nonetheless, this is the time to monitor the Bollinger Bands re-expansion signal, and then the relative position of the FBMACE above or below the Bollinger Middle Band shall determine the new direction.
Find this analysis useful? Why not share it with others? Click Here to send this to a friend
 1st Online Training In Malaysia |
 |
 |
 |
| View the Online Training | More Market Analysis | Find out more about WinChart | Upcoming Events |
Straits Index (M)
Sdn Bhd
No. 16, Jalan LP 1A / 5, Lestari Perdana,
43300 Seri Kembangan, Selangor
Hotline: (03) 8941 6828 (5
lines) Fax: (03) 8941 9828
Email: info@straitsindex.com
© Copyright 1997-2010 Straits Index (M) Sdn Bhd All
rights reserved