WinChart Technical Analysis
Daily Market analysis
| We
are an approved Securities Industry Development Corporation (SIDC)-CPE Training Provider. the training and development arm of the Securities Commission Malaysia (SC). |
|||
 |
 |
||
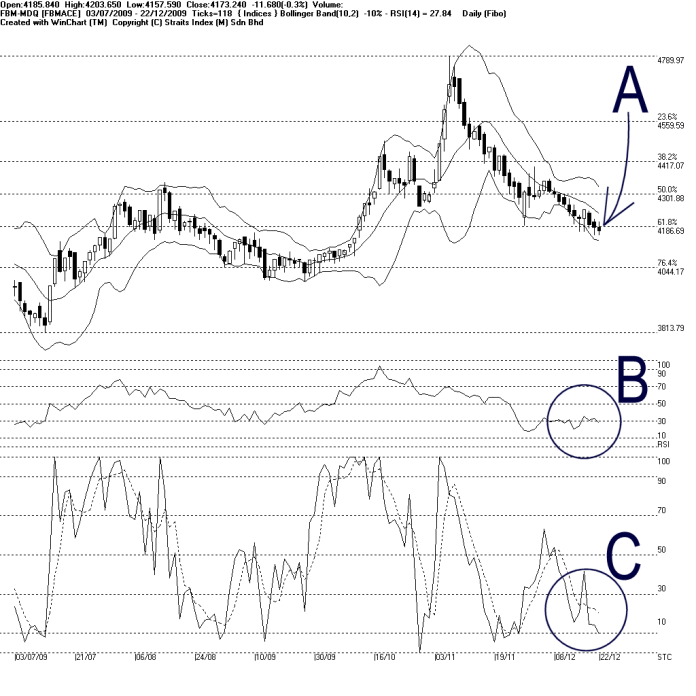
As indicated by A, the FBMACE broke below the 4187 WinChart Automatic Fibonacci Retracement on Tuesday, closing at 4173.24 points, losing 11.68 points. Therefore, the immediate resistance for the FBMACE is now at 4187 WinChart Automatic Fibonacci Retracement followed by the Bollinger Middle Band dynamic resistance; while the support is at 4044 WinChart Automatic Fibonacci Retracement.
As shown on the chart above, the Bollinger Bands contracted 10%, and this is a signal suggesting that the FBMACE is about to consolidate. However, since the FBMACE is still situated below the Bollinger Middle Band, the immediate outlook is still on the negative side.
As circled at B, the WinChart RSI breaks below 30% by margin, re-entering the mid term bearish region. This suggests that the mid term strength for the FBMACE is still weakening. If the WinChart RSI should remain below 30% level, the weakness of the FBMACE is expected to carry on.
As circled at C, the Stochastic is still falling while touching 10% level. Therefore, the short term bearish signal remains intact. Technically, the Stochastic has to break above 30% level, in order to trigger a technical rebound signal.
With the Bollinger Bands contracting, the FBMACE is expected to consolidate but the immediate outlook remains bearish biased. The FBMACE has to break above the Bollinger Middle Band with the Bollinger Bands expanding, then only it shall break away from the current downtrend. Or else, any rebound below the Bollinger Middle Band shall only be considered as a technical rebound.
Find this analysis useful? Why not share it with others? Click Here to send this to a friend
 1st Online Training In Malaysia |
 |
 |
 |
| View the Online Training | More Market Analysis | Find out more about WinChart | Upcoming Events |
Straits Index (M)
Sdn Bhd
No. 16, Jalan LP 1A / 5, Lestari Perdana,
43300 Seri Kembangan, Selangor
Hotline: (03) 8941 6828 (5
lines) Fax: (03) 8941 9828
Email: info@straitsindex.com
© Copyright 1997-2009 Straits Index (M) Sdn Bhd All
rights reserved