WinChart Technical Analysis - Daily Market analysis

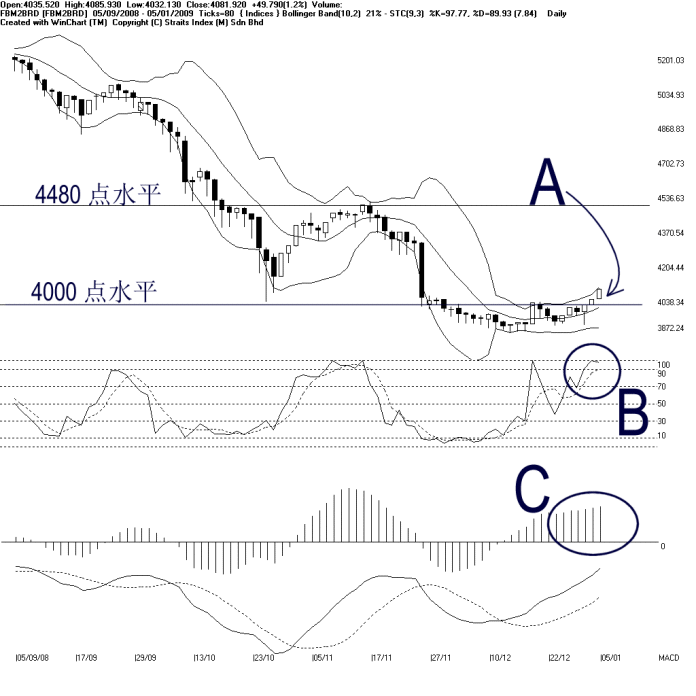
As indicated by A, the Bollinger Bands Width of the FBM2nd Board Index expanded 21% on Monday, with the FBM2nd Board Index staying above the Bollinger Middle Band; therefore, the Bollinger Bands Width is now showing a bullish biased signal for the FBM2nd Board Index. As long as the Bollinger Bands Width is still expanding, the bullish movement of the FBM2nd Board Index is expected to continue. Support for the FBM2nd Board Index is at the Bollinger Middle Band dynamic support while the resistance is still at 4480 level.
As circled at B, the Stochastic continue rising while staying above 70% level, which is the short term bullish region. This shows that the market movement for the short term is still bullish biased. If the Stochastic should fall below 70% level, it would be a signal suggesting a beginning of a technical correction.
As circled at C, the MACD histogram continue its rising momentum, suggesting that the FBM2nd Board Index is still gaining strength. With the Bollinger Bands Width expanding signal, positive movement of the is expected to continue until the MACD histogram should form a rounding top.
Find this analysis useful? Why not share it with others? Click Here to send this to a friend
 1st Online Training In Malaysia |
 |
 |
 |
| View the Online Training | More Market Analysis | Find out more about WinChart | Upcoming Events |
Straits Index (M)
Sdn Bhd
No. 16, Jalan LP 1A / 5, Lestari Perdana,
43300 Seri Kembangan, Selangor
Hotline: (03) 8941 6828 (5
lines) Fax: (03) 8941 9828
Email: info@straitsindex.com
© Copyright 1997-2007 Straits Index (M) Sdn Bhd All
rights reserved