Winchart Technical Analysis - Daily Market analysis

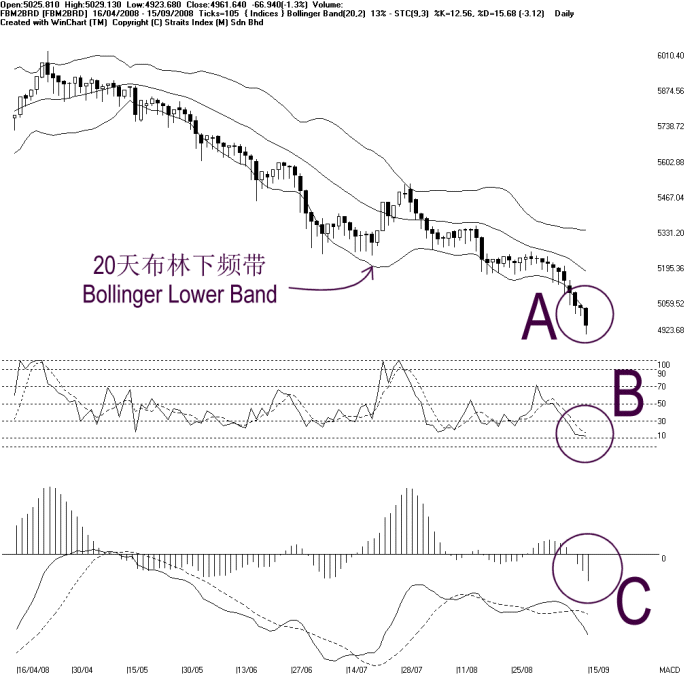
As shown on the chart above, the FBM2nd Board Index breaks below the 5000 points support, touching another new low with 4923.68 points. Meanwhile, as circled at A, the FBM2nd Board Index breaks below the 20-day Bollinger Lower Band, suggesting that the current movement of the FBM2nd Board Index is indeed bearish, but is slightly over-sold. Generally, when the FBM2nd Board Index is breaking below the 20-day Bollinger Lower Band a pull-back effect as a form of a technical rebound is likely to take place in the near term, and the FBM2nd Board Index would have a chance to consolidate.
As circled at B, the Stochastic remains below the 30% level, which is the short term bearish region. Therefore, the market movement for the short term is still bearish biased. However, readers can monitor the Stochastic for if the Stochastic should break above the 30% level, it would be a signal suggesting a beginning of a technical rebound.
As circled at C, the MACD histogram is still falling while showing the rounding top, therefore, suggesting that the FBM2nd Board Index is still going weak, and the weakness of the FBM2nd Board Index is expected to continue until the MACD histogram should form a rounding bottom.
Find this analysis useful? Why not share it with others? Click Here to send this to a friend
 1st Online Training In Malaysia |
 |
 |
 |
| View the Online Training | More Market Analysis | Find out more about WinChart | Upcoming Events |
Straits Index (M)
Sdn Bhd
No. 16, Jalan LP 1A / 5, Lestari Perdana,
43300 Seri Kembangan, Selangor
Hotline: (03) 8941 6828 (5
lines) Fax: (03) 8941 9828
Email: info@straitsindex.com
© Copyright 1997-2007 Straits Index (M) Sdn Bhd All
rights reserved