Winchart Technical Analysis - Daily Market analysis

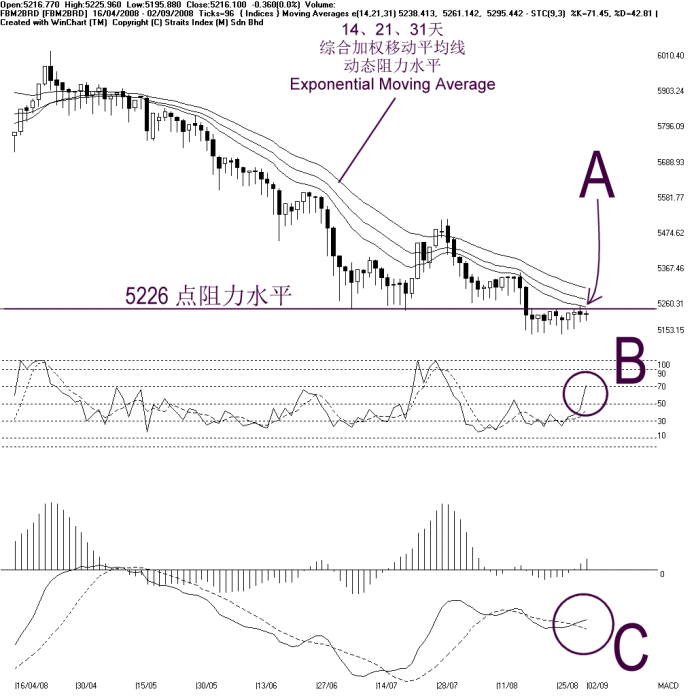
As shown on the chart above, the FBM2nd Board Index remains in its narrow consolidation range, closing almost unchanged (-0.36 points) to 5216.10 points. Meanwhile, as indicated by A, the 14, 21, 31 EMA dynamic resistance remains intact, and therefore, technically, the FBM2nd Board Index is still in its downtrend, with the current support at 5153.15 WinChart Automatic Fibonacci Retracement.
As circled at B, the Stochastic %K line breaks above the 70% by margin on Tuesday, and if the Stochastic %D line should also breaking above the 70% level, it would be a short term bullish signal for the FBM2nd Board Index. Generally, the Stochastic has to maintain above the 70% level to sustain the short term bullish movement.
As circled at C, the MACD line crosses above the trigger line, suggesting a bullish signal. Therefore, the MACD histogram now now above the zero level. Provided that the MACD histogram is still rising, the MACD bullish signal is expected to continue while suggesting that the FBM2nd Board Index movement is likely to improve, the improvement shall continue until the MACD histogram should form a rounding top.
Find this analysis useful? Why not share it with others? Click Here to send this to a friend
 1st Online Training In Malaysia |
 |
 |
 |
| View the Online Training | More Market Analysis | Find out more about WinChart | Upcoming Events |
Straits Index (M)
Sdn Bhd
No. 16, Jalan LP 1A / 5, Lestari Perdana,
43300 Seri Kembangan, Selangor
Hotline: (03) 8941 6828 (5
lines) Fax: (03) 8941 9828
Email: info@straitsindex.com
© Copyright 1997-2007 Straits Index (M) Sdn Bhd All
rights reserved