Winchart Technical Analysis - Daily Market analysis

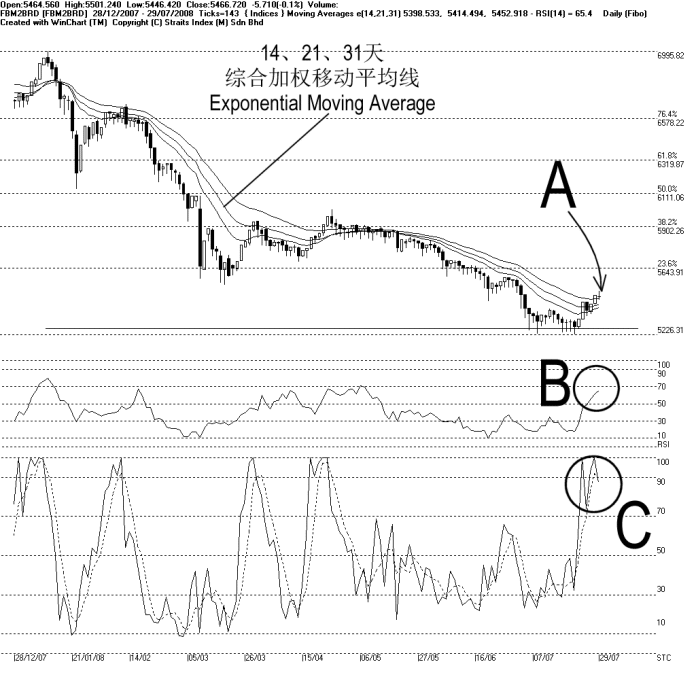
Despite having an intra-day high touching at 5501.24 points, the FBM2nd Board Index closed 5.71 points lower to 5466.72 points. As indicated by A, the FBM2nd Board Index is still staying above the 14, 21, 31 EMA, and therefore, there is still a chance for the 14, 21, 31 EMA to become the dynamic support for the FBM2nd Board Index. Nevertheless, resistance for the FBM2nd Board Index is still at 5644 WinChart Automatic Fibonacci Retracement and the support is still at 5255.25 or 5226.31 WinChart Automatic Fibonacci Retracement line.
As circled at B, the WinChart RSI is still rising, and getting closer to the 70% level. If the WinChart RSI should break above the 70% level, it would be a mid term bullish signal for the FBM2nd Board Index.
As circled at C, the Stochastic retreated slightly after hitting 100% level. However, it is still above the 70% level, suggesting that the short term movement for the FBM2nd Board Index is still bullish biased. Nonetheless, if the Stochastic should break below the 70% level, it would be the end of the short term bullish signal, thus a beginning of a technical correction signal.
Find this analysis useful? Why not share it with others? Click Here to send this to a friend
 1st Online Training In Malaysia |
 |
 |
 |
| View the Online Training | More Market Analysis | Find out more about WinChart | Upcoming Events |
Straits Index (M)
Sdn Bhd
No. 16, Jalan LP 1A / 5, Lestari Perdana,
43300 Seri Kembangan, Selangor
Hotline: (03) 8941 6828 (5
lines) Fax: (03) 8941 9828
Email: info@straitsindex.com
© Copyright 1997-2007 Straits Index (M) Sdn Bhd All
rights reserved