Winchart Technical Analysis - Daily Market analysis

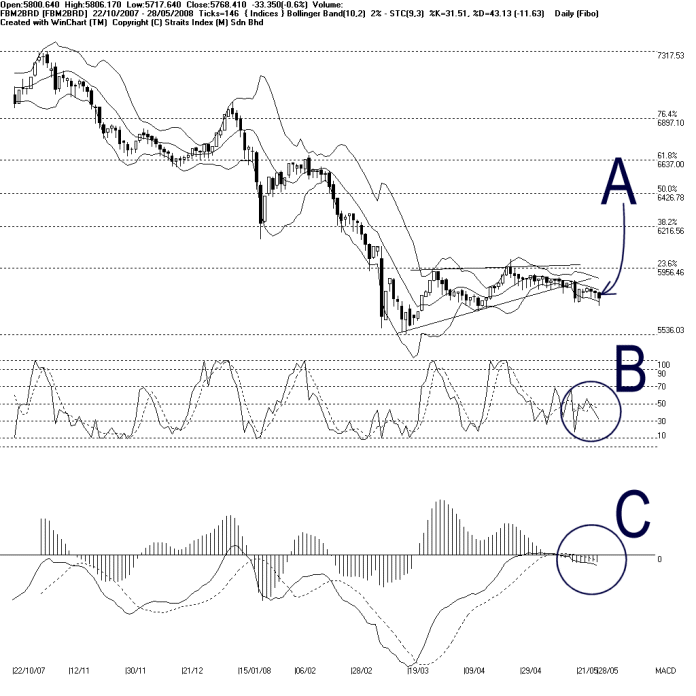
As indicated by A, the Bollinger Bands Width expanded only 2% on Wednesday. Although the number is insignificant, the FBM2nd Board Index remains below the Bollinger Middle Band, and ended 33.35 points lower. Still, the Bollinger Bands is still suggesting a bearish biased signal for the FBM2nd Board Index. Support for the FBM2nd Board Index is still at 5536 Fibonacci Retracement line while the resistance is still at 5956 Fibonacci Retracement line.
As circled at B, the Stochastic falls lower on Wednesday, but has not broken below the 30% level. If the Stochastic should break below the 30% level, it would enter a short term bearish region, and the market movement for the short term would be bearish biased.
As circled at C, the MACD histogram ticked lower on Wednesday. Therefore, the MACD histogram failed to form a rounding bottom. The falling of the MACD histogram suggests the FBM2nd Board Index is turning weak again after a brief technical rebound. Therefore, should the MACD histogram continue falling, the FBM2nd Board Index is expected to remain weak.
Find this analysis useful? Why not share it with others? Click Here to send this to a friend
 1st Online Training In Malaysia |
 |
 |
 |
| View the Online Training | More Market Analysis | Find out more about WinChart | Upcoming Events |
Straits Index (M)
Sdn Bhd
No. 16, Jalan LP 1A / 5, Lestari Perdana,
43300 Seri Kembangan, Selangor
Hotline: (03) 8941 6828 (5
lines) Fax: (03) 8941 9828
Email: info@straitsindex.com
© Copyright 1997-2007 Straits Index (M) Sdn Bhd All
rights reserved