Winchart Technical Analysis -
Daily Market analysis

| Learn Technical Analysis and get your credit hours at the same time. WinChart Technical Analysis Training is Accredited by: | |||
 |
 |
||
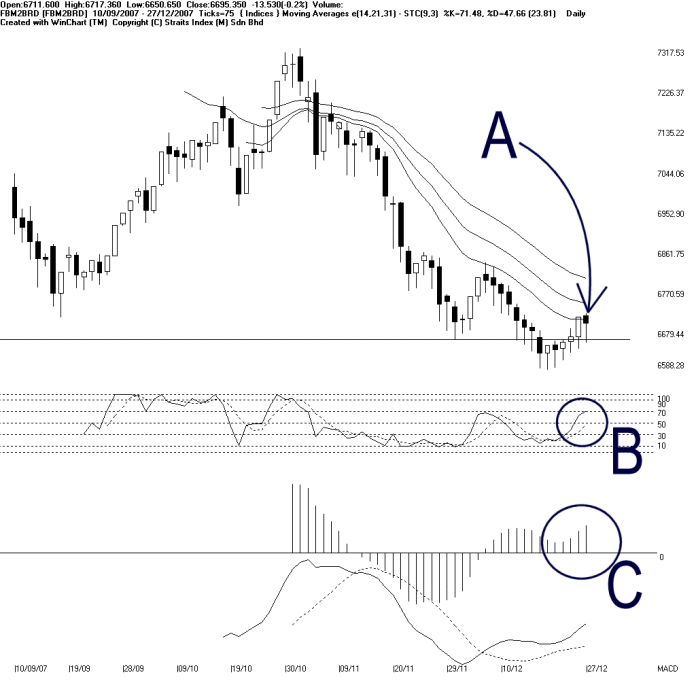
As indicated by A, the FBM2nd Board Index failed to break out from the 14-EMA after tested it yesterday. Therefore, the 14, 21, 31 EMA is still the dynamic resistance for the FBM2nd Board Index, and as long as the FBM2nd Board Index is still resisted by the falling dynamic resistance, the outlook shall remains bearish biased.
As circled at B, the Stochastic is still showing a short tern neutral signal. If the Stochastic should break above the 70% level, it would be a short term bullish signal, and the market movement for the short term would likely to be bullish biased.
As circled at C, the MACD continued rising on Thursday, and the Rounding Bottom signal remains intact. However, since the FBM2nd Board Index is still resisted by the dynamic resistance, readers are advised to monitor the MACD histogram. If the MACD histogram should form a rounding top, it would be a signal suggesting that the FBM2nd Board Index is weakening.
Find this analysis useful? Why not share it with others? Click Here to send this to a friend
 1st Online Training In Malaysia |
 |
 |
 |
| View the Online Training | More Market Analysis | Find out more about WinChart | Upcoming Events |
Straits Index (M)
Sdn Bhd
No. 16, Jalan LP 1A / 5, Lestari Perdana,
43300 Seri Kembangan, Selangor
Hotline: (03) 8941 6828 (5 lines) Fax: (03) 8941
9828
Email: info@straitsindex.com
© Copyright 1997-2007 Straits Index (M) Sdn Bhd All
rights reserved