Winchart Technical Analysis -
Daily Market analysis

| Learn Technical Analysis and get your credit hours at the same time. WinChart Technical Analysis Training is Accredited by: | |||
 |
 |
||
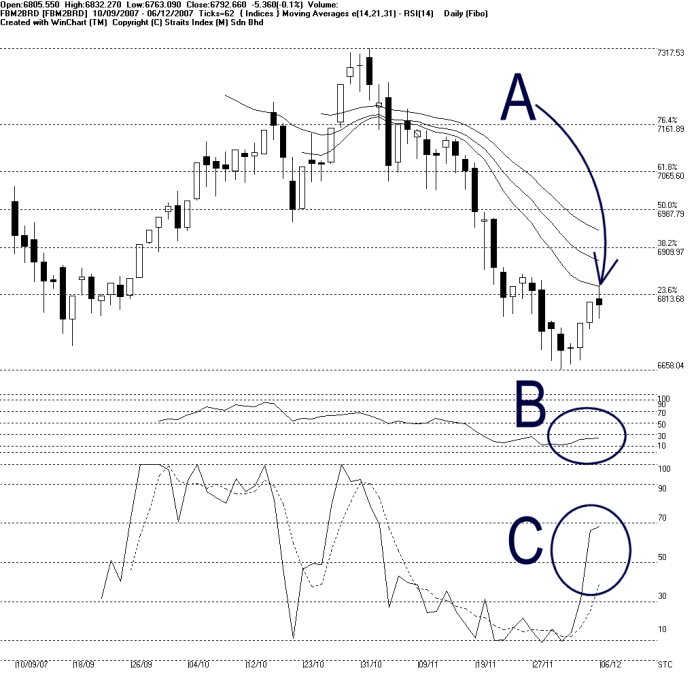
As indicated by A, the FBM2nd Board Index was precisely resisted by the 14-day EMA on Thursday, after technically rebounded for two days. This shows that the 14, 21, 31 EMA is still the dynamic resistance for the FBM2nd Board Index, and if the FBM2nd Board Index should continue resisted by the dynamic resistance, the bearish biased movement shall resume. Nevertheless, 6658.04 points is still the support for the FBM2nd Board Index.
As circled at B, WinChart RSI is still staying below the 30% level, which is the mid term bearish region. Therefore, WinChart RSI is suggesting a bearish biased strength for the FBM2nd Board Index for the mid term.
As circled at C, the Stochastic %D line breaks above the 30% level on Thursday, confirming the %K line short term neutral signal. However, currently the Stochastic is still showing a short term neutral signal for the %K is still below the 70% level.
Find this analysis useful? Why not share it with others? Click Here to send this to a friend
 1st Online Training In Malaysia |
 |
 |
 |
| View the Online Training | More Market Analysis | Find out more about WinChart | Upcoming Events |
Straits Index (M)
Sdn Bhd
No. 16, Jalan LP 1A / 5, Lestari Perdana,
43300 Seri Kembangan, Selangor
Hotline: (03) 8941 6828 (5 lines) Fax: (03) 8941
9828
Email: info@straitsindex.com
© Copyright 1997-2007 Straits Index (M) Sdn Bhd All
rights reserved