Winchart Technical Analysis -
Daily Market analysis

| Learn Technical Analysis and get your credit hours at the same time. WinChart Technical Analysis Training is Accredited by: | |||
 |
 |
||
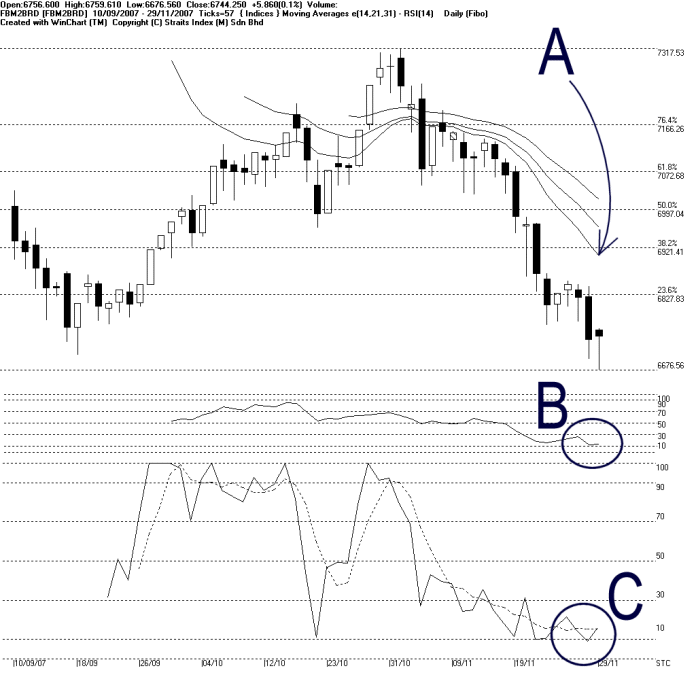
The FBM2nd Board Index had a daily low reaching 6676.56 points, breaking below yesterday's support at 6698.54 points. However, it rebounded strongly at the last minute, closing 5.86 points higher to 6744.25 points. Despite its rebound, the 14, 21, 31 EMA is still falling while serving as the dynamic resistance for the FBM2nd Board Index. (Study A). Therefore, the outlook for the FBM2nd Board Index is still bearish biased.
As circled at B, WinChart RSI is still showing a mid term bearish signal, with the WinChart RSI staying below the 30% level. This suggests that the current market strength for the FBM2nd Board Index is still weak.
As circled at C, the Stochastic short term bearish signal remains intact with the Stochastic still situated below the 30% level. If the Stochastic should break above the 30% level, it would mark and end to the short term bearish signal, and the FBM2nd Board Index would have a good chance of a consolidation, and stop the decline temporary.
Find this analysis useful? Why not share it with others? Click Here to send this to a friend
 1st Online Training In Malaysia |
 |
 |
 |
| View the Online Training | More Market Analysis | Find out more about WinChart | Upcoming Events |
Straits Index (M)
Sdn Bhd
No. 16, Jalan LP 1A / 5, Lestari Perdana,
43300 Seri Kembangan, Selangor
Hotline: (03) 8941 6828 (5 lines) Fax: (03) 8941
9828
Email: info@straitsindex.com
© Copyright 1997-2007 Straits Index (M) Sdn Bhd All
rights reserved