Winchart Technical Analysis -
Daily Market analysis

| Learn Technical Analysis and get your credit hours at the same time. WinChart Technical Analysis Training is Accredited by: | |||
 |
 |
||
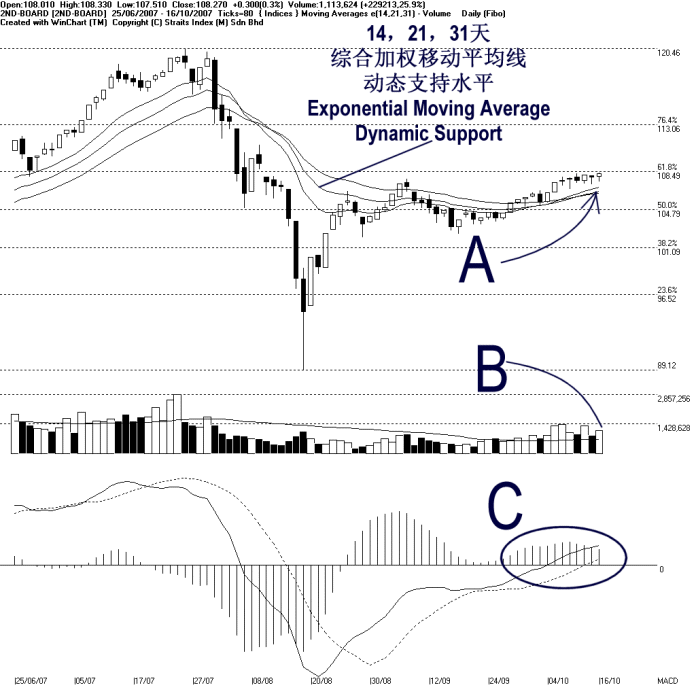
On Tuesday, the 2nd board index attempted to test the 108.49 Fibonacci Retracement Resistance and failed, closing at 108.27 points. Therefore, the 2nd board index remains in its consolidation. Meanwhile, the 14, 21, 31 EMA is still serving as the dynamic support for the 2nd board index. (Study A)
As indicated by B, volume for the 2nd board market increased 25.9% on Tuesday. This shows that the 2nd board market is still actively participated. If the volume should remains above the 40-day VMA level, the sentiment for the 2nd board market shall remains positive biased.
As circled at C, the MACD histogram continue falling and therefore, the rounding top signal remains intact. This rounding suggests a short term consolidation or correction of the 2nd board index, and the consolidation is expected to continue, until the MACD histogram ticks up and form a rounding bottom.
Find this analysis useful? Why not share it with others? Click Here to send this to a friend
 1st Online Training In Malaysia |
 |
 |
 |
| View the Online Training | More Market Analysis | Find out more about WinChart | Upcoming Events |
Straits Index (M)
Sdn Bhd
No. 16, Jalan LP 1A / 5, Lestari Perdana,
43300 Seri Kembangan, Selangor
Hotline: (03) 8941 6828 (5 lines) Fax: (03) 8941
9828
Email: info@straitsindex.com
© Copyright 1997-2007 Straits Index (M) Sdn Bhd All
rights reserved