Winchart Technical Analysis -
Daily Market analysis

| Learn Technical Analysis and get your credit hours at the same time. WinChart Technical Analysis Training is Accredited by: | |||
 |
 |
||
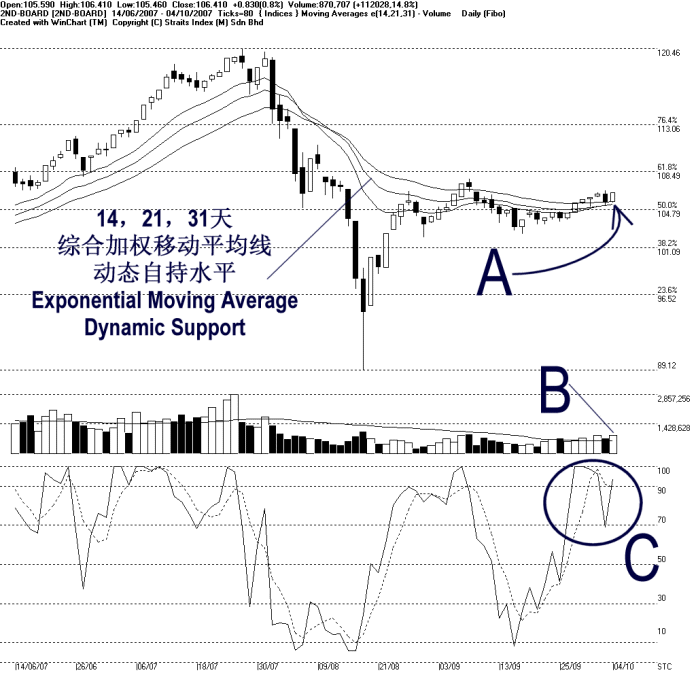
After a brief correction on Wednesday, the 2nd board index rebound from the 14, 21, 31 EMA on Thursday, closing at its daily high of 106.41 points, up 0.83 of a point. As indicated by A, the 14, 21, 31 EMA is still serving as the dynamic support for the 2nd board index, and as long as the 2nd board index can remains supported, the outlook shall be bullish biased. Nevertheless, the next resistance for the 2nd board index is still at 108.49 Fibonacci Retracement line.
As indicated by B, volume for the 2nd board market increased 14.8%, with volume staying above the 40-day VMA level. This shows that the market participation is relatively sufficient and if volume should remains above the 40-day VMA level, it would help sustain the bullish sentiment.
As circled at C, the Stochastic %K line rebounded on Thursday, and therefore, the short term bullish signal remains intact. As long as the Stochastic is still staying above the 70% level, which is the short term bullish region, the market movement for the short term is still bullish biased.
Find this analysis useful? Why not share it with others? Click Here to send this to a friend
 1st Online Training In Malaysia |
 |
 |
 |
| View the Online Training | More Market Analysis | Find out more about WinChart | Upcoming Events |
Straits Index (M)
Sdn Bhd
No. 16, Jalan LP 1A / 5, Lestari Perdana,
43300 Seri Kembangan, Selangor
Hotline: (03) 8941 6828 (5 lines) Fax: (03) 8941
9828
Email: info@straitsindex.com
© Copyright 1997-2007 Straits Index (M) Sdn Bhd All
rights reserved