Winchart Technical Analysis -
Daily Market analysis

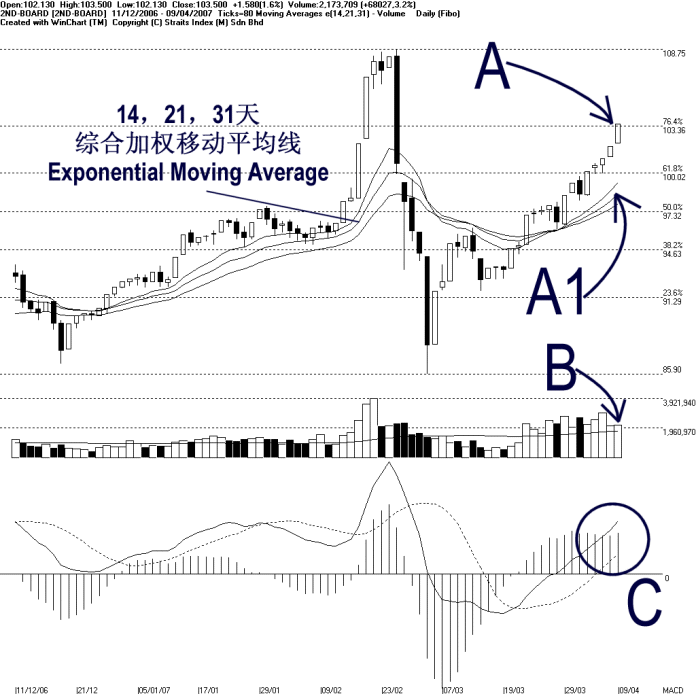
As shown on the chart above, the 2nd board index tested the 103.36 Fibonacci Retracement on Monday (Study A), closing 1.58 points higher to 103.50 points. Mean while, the 14, 21, 31 EMA is still serving as the rising dynamic support to the 2nd board index. If a technical correction of the 2nd board index took place, the dynamic support would be a crucial uptrend support. If the 2nd board index could stay above the rising dynamic support, the uptrend shall remained intact. (Study A1)
Volume for the 2nd board market increased 3.2%, while remained above the 40 days VMA level. This suggested that the 2nd board market is still actively participated. Therefore, provided that the volume could remained above the 40 days VMA level, the bullish sentiment for the 2nd board index is likely to sustain. (Study B)
On Monday, the MACD histogram ticked up, suggested a continuation of the MACD bullish signal. Nevertheless, provided that the MACD line could continue rising while staying above the trigger line, the MACD bullish signal remained intact. (Study C)
Find this analysis useful? Why not share it with others? Click Here to send this to a friend
 1st Online Training In Malaysia |
 |
 |
 |
| View the Online Training | More Market Analysis | Find out more about WinChart | Upcoming Events |
Straits Index (M)
Sdn Bhd
No. 16, Jalan LP 1A / 5, Lestari Perdana,
43300 Seri Kembangan, Selangor
Hotline: (03) 8941 6828 (5 lines) Fax: (03) 8941
9828
Email: info@straitsindex.com
© Copyright 1997-2007 Straits Index (M) Sdn Bhd All
rights reserved