Winchart Technical Analysis -
Daily Market analysis

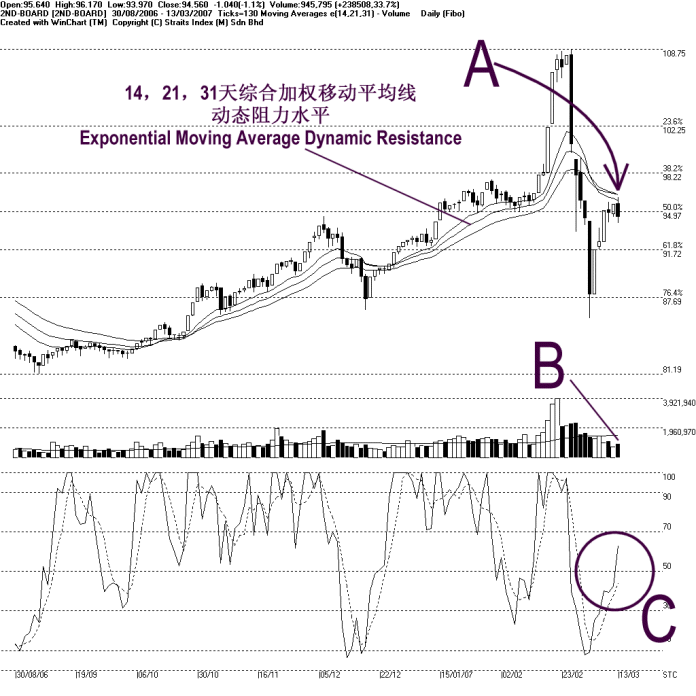
After testing the 14, 21, 31 EMA resistance for 3rd consecutive days, the 2nd board remained resisted by the falling 14, 21, 31 EMA. Therefore, the 14, 21, 31 EMA is still serving as the dynamic resistance to the 2nd board index. Provided that the 2nd board index remained below the falling 14, 21, 31 EMA, the outlook for the 2nd board index shall remained bearish bias. Nevertheless, the next support level for the 2nd board index is at 87.69 Fibonacci Retracement.
Despite the volume for the 2nd board market increased, it failed to break above the 40 days VMA level. This suggested that the overall market participation is relatively still weak. Therefore, the 2nd board index is likely to stay weak with insufficient market participation. (Study B)
As circled by C, at the moment, the Stochastic is showing a short-term neutral signal. If the Stochastic fell below 30% level, it shall be another short-term bearish signal. (Study C)
Find this analysis useful? Why not share it with others? Click Here to send this to a friend
 1st Online Training In Malaysia |
 |
 |
 |
| View the Online Training | More Market Analysis | Find out more about WinChart | Upcoming Events |
Straits Index (M)
Sdn Bhd
No. 16, Jalan LP 1A / 5, Lestari Perdana,
43300 Seri Kembangan, Selangor
Hotline: (03) 8941 6828 (5 lines) Fax: (03) 8941
9828
Email: info@straitsindex.com
© Copyright 1997-2007 Straits Index (M) Sdn Bhd All
rights reserved