Winchart Technical Analysis -
Daily Market analysis

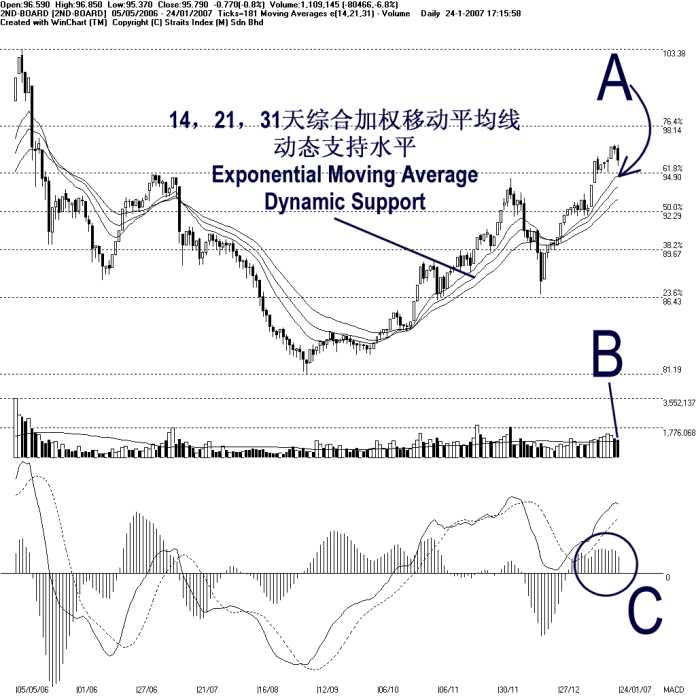
2nd board index retreated on Wednesday, closing 0.77 of a point lower to 95.79 points. As pointed by A, the 2nd board index is having a technical correction, and now testing the immediate support at the 94.90 Fibonacci Retracement. Mean while, the 14, 21, 31 EMA shall remained as the dynamic support to the 2nd board index. If the 2nd board index could rebound from the rising dynamic support, the uptrend for the 2nd board index would still be intact. (Study A)
Volume for the 2nd board market continued declined slightly on Wednesday. Generally, a decreased of volume during a correction stage is considered as normal. However, if the 2nd board index was to rebound from the dynamic support and resume its uptrend, an increase of volume above the 40 days VMA level would be the crucial element. (Study B)
As circled by C, MACD histogram continued falling, and confirmed the rounding top signal. This suggested that the 2nd board index is at a technical correction stage. Provided that the histogram remained falling, the short-term market movement for the 2nd board is expected to stay weak. (Study C)
Find this analysis useful? Why not share it with others? Click Here to send this to a friend
 1st Online Training In Malaysia |
 |
 |
 |
| View the Online Training | More Market Analysis | Find out more about WinChart | Upcoming Events |
Straits Index (M)
Sdn Bhd
No. 16, Jalan LP 1A / 5, Lestari Perdana,
43300 Seri Kembangan, Selangor
Hotline: (03) 8941 6828 (5
lines) Fax: (03) 8941 9828
Email: info@straitsindex.com
© Copyright 1997-2007 Straits Index (M) Sdn Bhd All
rights reserved