WinChart Technical Analysis
Daily Market analysis

| Learn Technical Analysis and get your credit hours at the same time. WinChart Technical Analysis Training is Accredited by: | |||
 |
 |
||
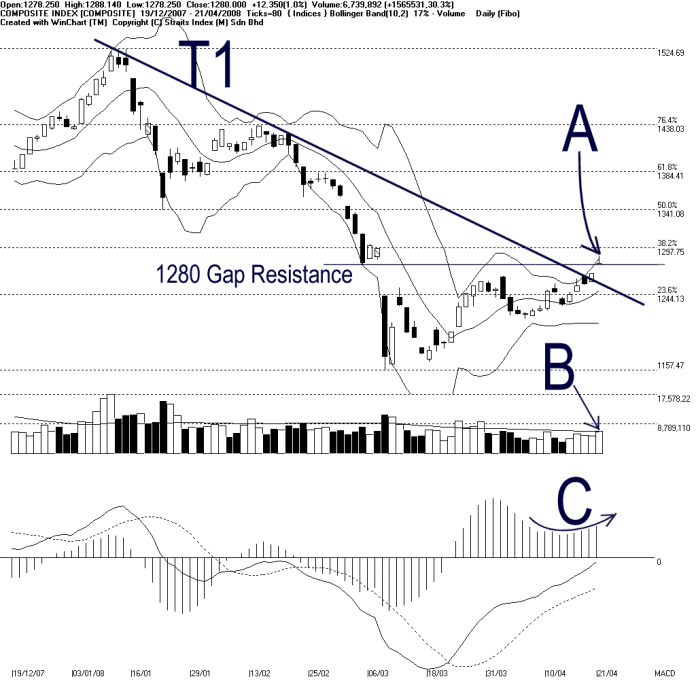
As indicate by A, the Bollinger Bands Width expanded another 17%, and the KLCI is still staying above the Bollinger Middle Band, therefore, the expansion of the Bollinger Bands Width suggests an increase of upside volatility for the KLCI.
Meanwhile, the KLCI is now precisely testing the 1280 gap resistance, and the 1300 psychological level is also another resistance for the KLCI.
As indicated by B, total market volume increased 30.3% on Monday, and it managed to break above the 40-day VMA level by margin. This is a sign of improvement of the market participation. If the volume remain above the 40-day VMA level, the KLCI is likely to sustain its bullish Bollinger Bands signal.
As indicated by C, the MACD histogram continue rising on Monday, with the rounding bottom still clearly sighted. Also, the MACD line is set to test the zero line. Nevertheless, provided that the MACD histogram is still rising, the bullish MACD signal is likely to continue.
Find this analysis useful? Why not share it with others? Click Here to send this to a friend
 1st Online Training In Malaysia |
 |
 |
 |
| View the Online Training | More Market Analysis | Find out more about WinChart | Upcoming Events |
Straits Index (M)
Sdn Bhd
No. 16, Jalan LP 1A / 5, Lestari Perdana,
43300 Seri Kembangan, Selangor
Hotline: (03) 8941 6828 (5
lines) Fax: (03) 8941 9828
Email: info@straitsindex.com
© Copyright 1997-2008 Straits Index (M) Sdn Bhd All
rights reserved