WinChart Technical Analysis
Daily Market analysis

| Learn Technical Analysis and get your credit hours at the same time. WinChart Technical Analysis Training is Accredited by: | |||
 |
 |
||
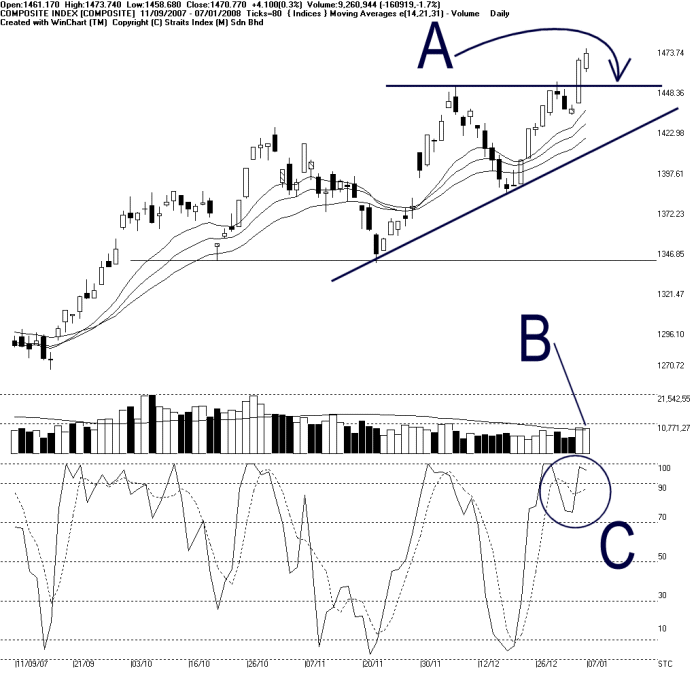
As shown the chart above, the KLCI ended 4.1 points higher despite opening at a lower level, mostly due to the US market ended lower. Nevertheless, as indicated by A, the 1450 is now the immediate support level for the KLCI. If the KLCI should stay above the 1450 level, the 14, 21, 31 EMA shall continue serving as the dynamic support for the KLCI.
As indicated by B, total market volume declined 1.7% on Monday, while barely hanging above the 40-day VMA level. This shows some weakness for the our local market for the market participation is still insufficient. Therefore, if volume should remains at this level, the sustainability of the KLCI bullish movement would be at risk.
As circled at c, the Stochastic is still staying above the 70% level, which is the short term bullish region. Therefore, the Stochastic is suggesting a short term bullish signal and the market movement for the short term shall remain bullish biased.
Find this analysis useful? Why not share it with others? Click Here to send this to a friend
 1st Online Training In Malaysia |
 |
 |
 |
| View the Online Training | More Market Analysis | Find out more about WinChart | Upcoming Events |
Straits Index (M)
Sdn Bhd
No. 16, Jalan LP 1A / 5, Lestari Perdana,
43300 Seri Kembangan, Selangor
Hotline: (03) 8941 6828 (5
lines) Fax: (03) 8941 9828
Email: info@straitsindex.com
© Copyright 1997-2008 Straits Index (M) Sdn Bhd All
rights reserved