Winchart Technical Analysis
Daily Market analysis

| Learn Technical Analysis and get your credit hours at the same time. WinChart Technical Analysis Training is Accredited by: | |||
 |
 |
||
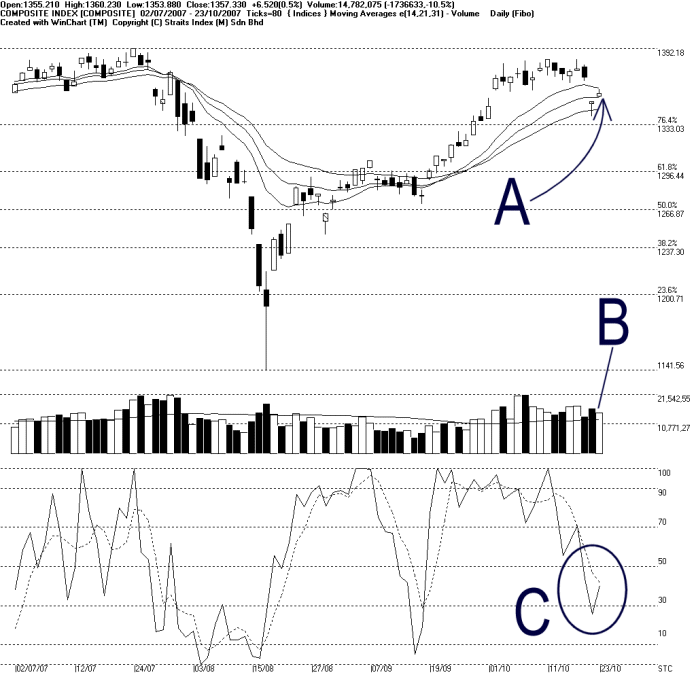
As indicated by A, the KLCI rebounded an retested the 14, 21, 31 EMA, closing 6.52 points higher to 1357.33 points. At the moment, the KLCI has not form any new trend, for it is still staying in the congestion zone. If the KLCI should remains resisted by the 14, 21, 31 EMA, the outlook shall turn negative. Nevertheless, support for the KLCI remains in 1333.03 Fibonacci Retracement.
As indicated by B, total market volume remains above the 40-day VMA level, suggesting that the overall market is still actively participated. If the KLCI should resume its position above the 14, 21, 31 EMA, with volume staying above the 40-day VMA level, there is a better chance for the KLCI to maintain its previous positive sentiment.
As circled at C, the Stochastic %K line rebounded and break above the 30% level, which is away from the short term bearish region. Therefore, at the moment, the Stochastic is suggesting a short term neutral signal.
Find this analysis useful? Why not share it with others? Click Here to send this to a friend
 1st Online Training In Malaysia |
 |
 |
 |
| View the Online Training | More Market Analysis | Find out more about WinChart | Upcoming Events |
Straits Index (M)
Sdn Bhd
No. 16, Jalan LP 1A / 5, Lestari Perdana,
43300 Seri Kembangan, Selangor
Hotline: (03) 8941 6828 (5
lines) Fax: (03) 8941 9828
Email: info@straitsindex.com
© Copyright 1997-2007 Straits Index (M) Sdn Bhd All
rights reserved