Winchart Technical Analysis
Daily Market analysis

| Learn Technical Analysis and get your credit hours at the same time. WinChart Technical Analysis Training is Accredited by: | |||
 |
 |
||
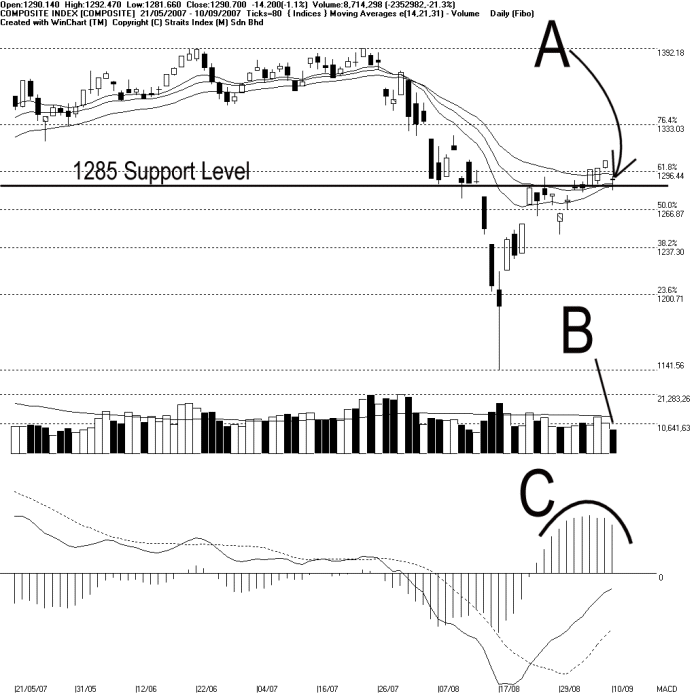
As indicated by A, the KLCI retreated 14.20 points on Monday, while supported by the 1285 support. As the KLCI falls into the congestion zone of the 14, 21, 31 EMA, direction for the KLCI remains unclear. Nevertheless, the KLCI must stay above the 14, 21, 31 EMA firmly in order to maintain its bullish outlook, and the next resistance is still seen at 1333 Fibonacci Retreacement Line.
Total market volume on Monday declined another 21.3%, with the KLCI staying further below the 40-day VMA level. Therefore, the overall market participation is still low, implying that the market confident is also relatively low. If the volume should remains below the 40-day VMA level, the market sentiment is expected to be weak.
On Monday, the MACD histogram ticked lower, and forming a rounding top signal. The rounding top suggests a weakening of the MACD bullish signal. Nevertheless, the MACD line is still below the zero-level, suggesting that the long term movement is still on the negative side.
Find this analysis useful? Why not share it with others? Click Here to send this to a friend
 1st Online Training In Malaysia |
 |
 |
 |
| View the Online Training | More Market Analysis | Find out more about WinChart | Upcoming Events |
Straits Index (M)
Sdn Bhd
No. 16, Jalan LP 1A / 5, Lestari Perdana,
43300 Seri Kembangan, Selangor
Hotline: (03) 8941 6828 (5
lines) Fax: (03) 8941 9828
Email: info@straitsindex.com
© Copyright 1997-2007 Straits Index (M) Sdn Bhd All
rights reserved