Winchart Technical Analysis
Daily Market analysis

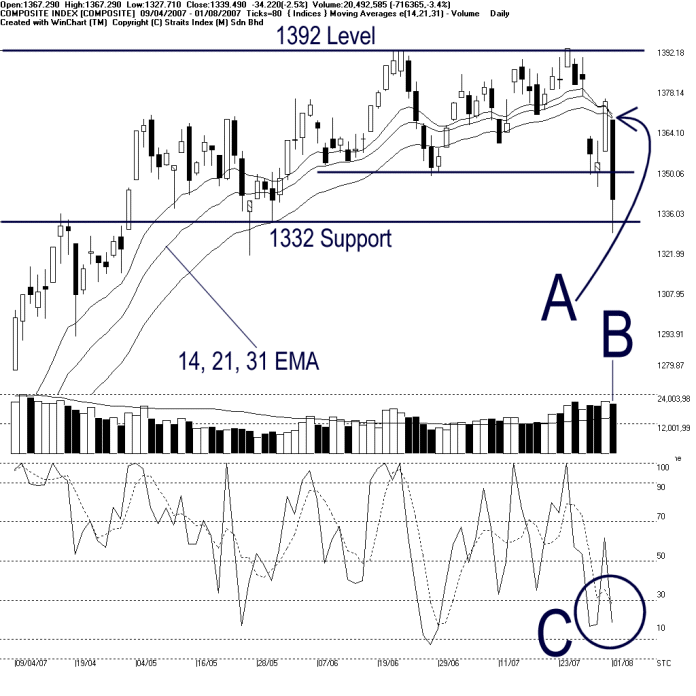
As indicated by A, the KLCI remains resisted by the 14, 21, 31 EMA, and therefore, the 14, 21, 31 EMA is now serving as the dynamic resistance. Provided that the KLCI is still staying below the falling EMA, the immediate outlook for the KLCI is likely to be bearish biased. (Study A) Currently, the 1332 level is the support for the KLCI.
As indicated by B, total market volume for Wednesday was 3.4% lower, while still staying above the 40-day VMA level. If the KLCI should continue falling with relatively higher volume, it would suggests an increase of selling pressure. (Study B)
As circled at C, the Stochastic % K and %D line entered below the 30% level, which suggested a short term bearish signal. If the Stochastic should continue staying below the 30% level, the market movement for the short term would be bearish biased. (Study C)
Find this analysis useful? Why not share it with others? Click Here to send this to a friend
 1st Online Training In Malaysia |
 |
 |
 |
| View the Online Training | More Market Analysis | Find out more about WinChart | Upcoming Events |
Straits Index (M)
Sdn Bhd
No. 16, Jalan LP 1A / 5, Lestari Perdana,
43300 Seri Kembangan, Selangor
Hotline: (03) 8941 6828 (5
lines) Fax: (03) 8941 9828
Email: info@straitsindex.com
© Copyright 1997-2007 Straits Index (M) Sdn Bhd All
rights reserved