Winchart Technical Analysis
Daily Market analysis

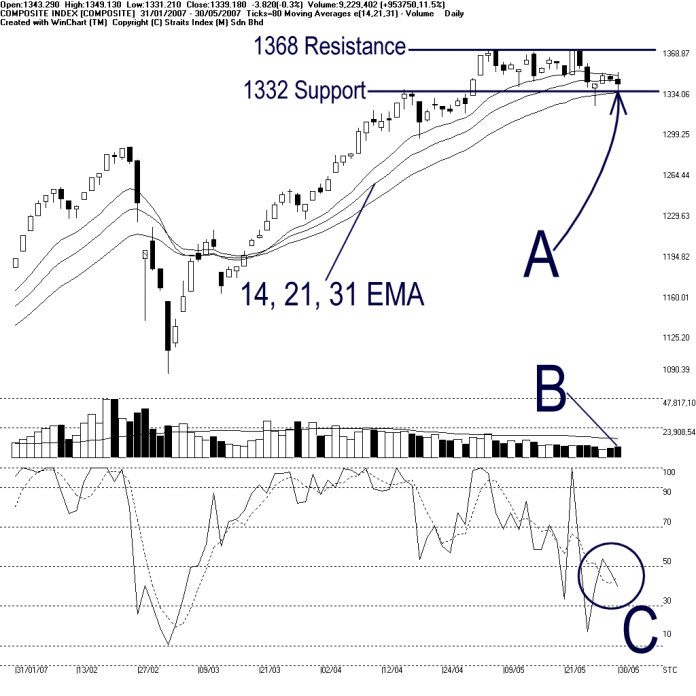
As shown on the chart above, the KLCI continues in its consolidation in the trading range between the 1332 support and 1368 resistance. As indicated by A, the KLCI rebounded from the 1332 support as well as the 31-day EMA dynamic support. Therefore, the 14, 21, 31 EMA dynamic support remains intact while the KLCI continues its sideways consolidation.
Total market volume for Wednesday increased 11.5% with about 923 million shares traded. However, as indicated by B, the market volume is still below the 40-day VMA level. Therefore, this suggests that the market is still lightly participated as investors remain in the sideline. The relatively low volume also implies a lack of inflow of fresh capital, and therefore, without sufficient inflow of fresh capital, the market is less likely to regain its strength.
As circled at C, the Stochastic is still staying around the 50% level, which is the short term neutral region. Therefore, the market movement for the short term is at neutral. If the Stochastic should fall below 30% level, it would be another short term bearish signal. (Study C)
Find this analysis useful? Why not share it with others? Click Here to send this to a friend
 1st Online Training In Malaysia |
 |
 |
 |
| View the Online Training | More Market Analysis | Find out more about WinChart | Upcoming Events |
Straits Index (M)
Sdn Bhd
No. 16, Jalan LP 1A / 5, Lestari Perdana,
43300 Seri Kembangan, Selangor
Hotline: (03) 8941 6828 (5
lines) Fax: (03) 8941 9828
Email: info@straitsindex.com
© Copyright 1997-2007 Straits Index (M) Sdn Bhd All
rights reserved