Winchart Technical Analysis
Daily Market analysis

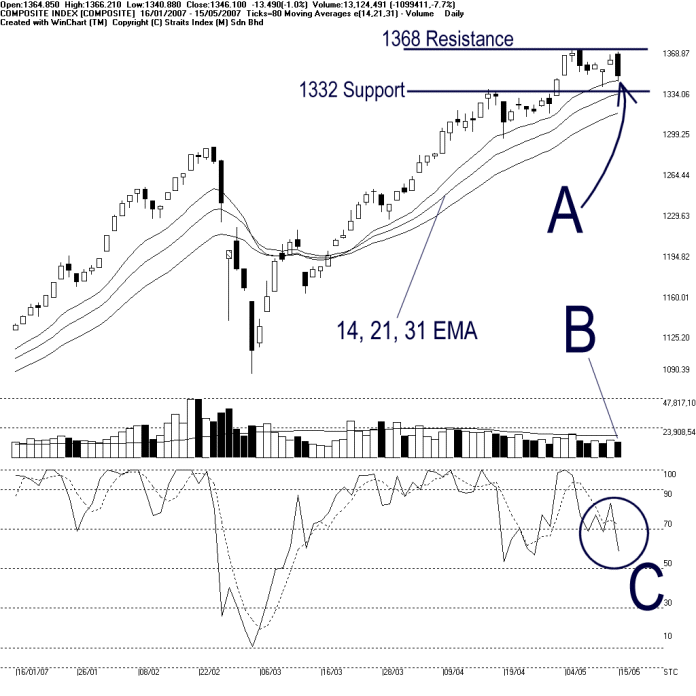
The KLCI attempted to retest the 1368 resistance level. However, as shown on the chart above, the KLCI is still resisted by the 1368 resistance, while managed to rebound from the 14-day EMA dynamic support. 1332 level is still the support of the KLCI, and the 14, 21, 31 EMA is still the dynamic support to the KLCI.
Total market volume declined 7.7% on Tuesday and continued staying below the 40-day VMA level. This suggests that the market is still lightly participated, and therefore, the KLCI is unlikely to regain its strength. Also, the sustainability of the KLCI uptrend is still questionable with the volume remaining below the 40-day VMA level. (Study B)
As circled at C, the Stochastic %K line fell below the 70% level, ended the short term bullish signal. If the Stochastic %D should fall below the 70% level, it shall confirm the %K signal, and the market movement for the short term would turn from bullish biased to neutral. (Study C)
Find this analysis useful? Why not share it with others? Click Here to send this to a friend
 1st Online Training In Malaysia |
 |
 |
 |
| View the Online Training | More Market Analysis | Find out more about WinChart | Upcoming Events |
Straits Index (M)
Sdn Bhd
No. 16, Jalan LP 1A / 5, Lestari Perdana,
43300 Seri Kembangan, Selangor
Hotline: (03) 8941 6828 (5
lines) Fax: (03) 8941 9828
Email: info@straitsindex.com
© Copyright 1997-2007 Straits Index (M) Sdn Bhd All
rights reserved