Winchart Technical Analysis
Daily Market analysis

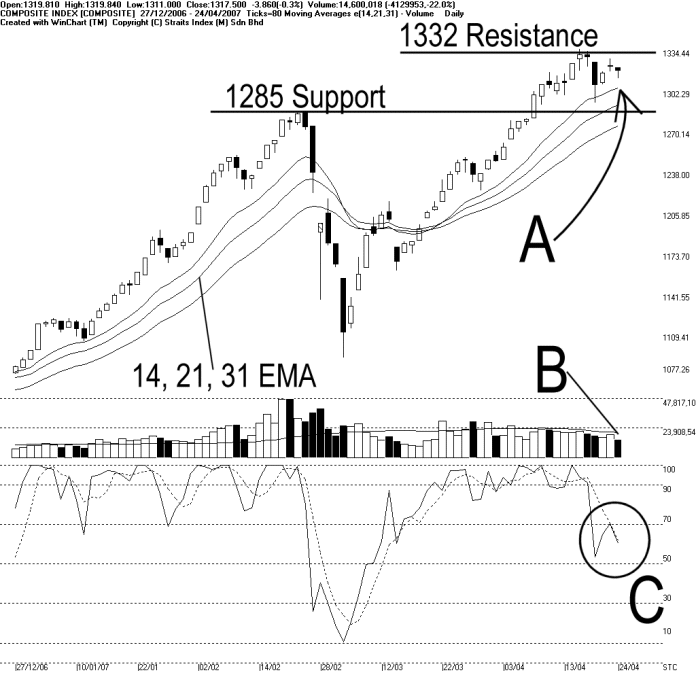
On Tuesday, the KLCI continued its consolidation ended the day at 1317.50 points. As shown on the chart above, the KLCI remains in the range between the 1285 support and the 1332 resistance, and therefore, the direction for the KLCI is still unclear. Meanwhile, as indicated by A, the 14, 21, 31 EMA is still serving as the dynamic support to the KLCI.
Total market volume decreased 22% on Tuesday, and continued staying below the
40-day VMA level. It would appear that investors chose to stay on the sidelines before the KLCI shows in the absence of a clearer trend by the KLCI. The lower volume also suggests a decline in capital inflow, thus the KLCI is likely to stay in consolidation mood. (Study B)
. (Study B)
Both %K and %D lines of the Stochastic are situated in the neutral region, suggesting that the market movement for the short term is at neutral. If the Stochastic should break above the 70% level, it would be the first signal suggesting a short term bullish signal. Likewise, if the Stochastic should fall below the 30% level, it would be the first short term bearish signal. (Study C)
Find this analysis useful? Why not share it with others? Click Here to send this to a friend
 1st Online Training In Malaysia |
 |
 |
 |
| View the Online Training | More Market Analysis | Find out more about WinChart | Upcoming Events |
Straits Index (M)
Sdn Bhd
No. 16, Jalan LP 1A / 5, Lestari Perdana,
43300 Seri Kembangan, Selangor
Hotline: (03) 8941 6828 (5
lines) Fax: (03) 8941 9828
Email: info@straitsindex.com
© Copyright 1997-2007 Straits Index (M) Sdn Bhd All
rights reserved