Winchart Technical Analysis
Daily Market analysis

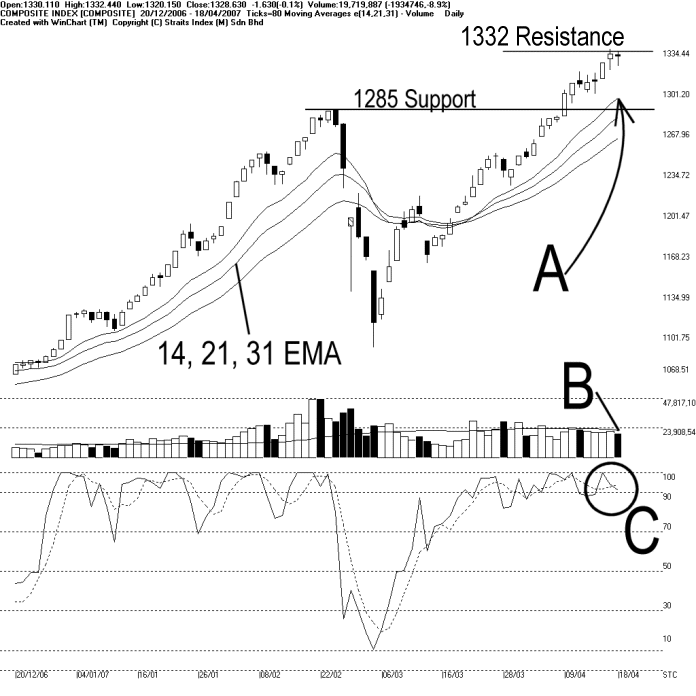
The KLCI had an intra-day high at 1332.44, closing the day at 1328.63 points, downed 1.63 points. As shown on the chart above, the KLCI is still resisted by the 1332 psychological resistance. Meanwhile, as indicated by A, the 14, 21, 31 EMA is still rising and continue serving as the dynamic support to the KLCI. Provided that the KLCI can be supported by the dynamic support, outlook for the KLCI is still positive biased. (Study A)
Total market volume declined 8.9% on Wednesday, while staying below the 40-day VMA level. As the KLCI still resisted by the 1332 resistance level, volume also declined as this may suggest that many investors are still cautiously waiting sideline, before the KLCI shows a clear direction. (Study B)
As circled at C, Stochastic is still staying above 90% level, which is the short-term over-bought region. Therefore, the risk of a technical correction remains intact. Nonetheless, provided that the Stochastic can maintain its position above 70% level, the market movement for the short-term is likely to be bullish biased. (Study C)
Find this analysis useful? Why not share it with others? Click Here to send this to a friend
 1st Online Training In Malaysia |
 |
 |
 |
| View the Online Training | More Market Analysis | Find out more about WinChart | Upcoming Events |
Straits Index (M)
Sdn Bhd
No. 16, Jalan LP 1A / 5, Lestari Perdana,
43300 Seri Kembangan, Selangor
Hotline: (03) 8941 6828 (5
lines) Fax: (03) 8941 9828
Email: info@straitsindex.com
© Copyright 1997-2007 Straits Index (M) Sdn Bhd All
rights reserved