Winchart Technical Analysis
Daily Market analysis

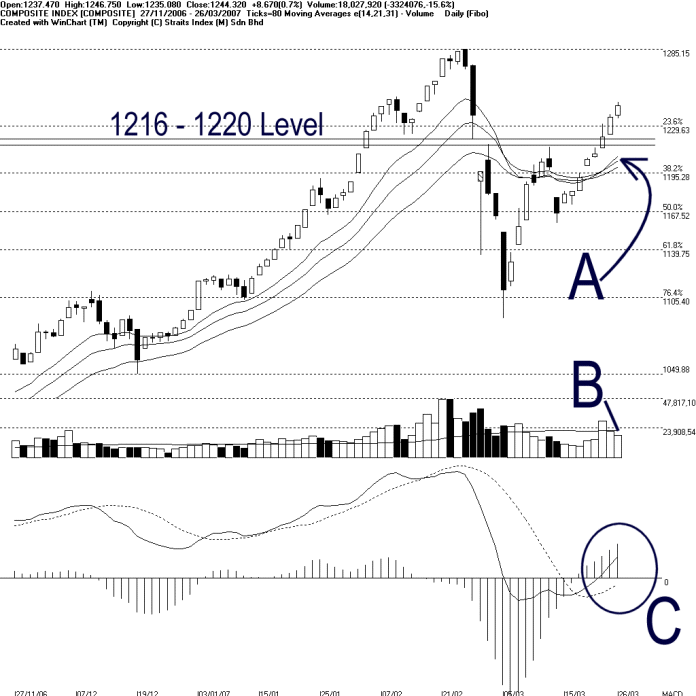
As shown on the chart above, the KLCI ended 8.67 points higher on Monday; while the 14, 21, 31 EMA remained rising and serving as the dynamic support. Immediate support for the KLCI is at 1220 Gap level. If the KLCI could stay above the rising EMA successfully, the next resistance for the KLCI is at 1285.15.
Although the KLCI was higher, the total market volume, on the other hand, declined another 15.6 %. Furthermore, total market volume on Monday failed to break above 40 days VMA level, suggested that the market was lightly participated. Therefore, the sustainability of the KLCI upward movement is questionable. (Study B)
As circled by C, MACD histogram continued rising, suggested that the bullish signal was gaining strength. If the MACD started falling and formed a rounding top, it would be a signal for a correction. (Study C)
Find this analysis useful? Why not share it with others? Click Here to send this to a friend
 1st Online Training In Malaysia |
 |
 |
 |
| View the Online Training | More Market Analysis | Find out more about WinChart | Upcoming Events |
Straits Index (M)
Sdn Bhd
No. 16, Jalan LP 1A / 5, Lestari Perdana,
43300 Seri Kembangan, Selangor
Hotline: (03) 8941 6828 (5
lines) Fax: (03) 8941 9828
Email: info@straitsindex.com
© Copyright 1997-2007 Straits Index (M) Sdn Bhd All
rights reserved