Winchart Technical Analysis
Daily Market analysis

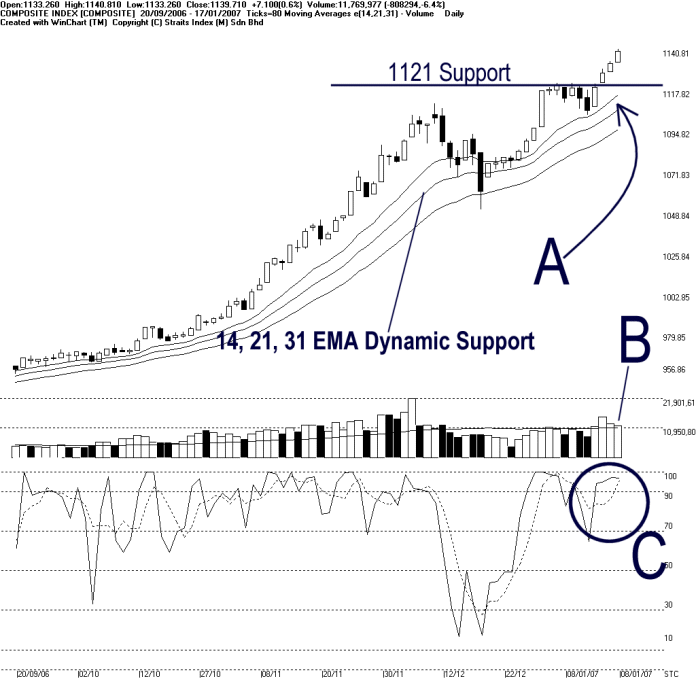
KLCI continued its rally on Wednesday, ended the day 7.10 points to 1139.71 points. Mean while, the 14, 21, 31 EMA continued rising while continued serving as the dynamic support to the KLCI. Provided that the KLCI could maintain its position above the dynamic support, the outlook for the KLCI remained positive bias. (Study A)
KLCI continued moving higher with declining market volume. On Wednesday, total market volume fell 6.4% to 11.77 million shares. However, total market volume managed to stay above the the 40 days VMA level marginally, suggested that the market participation was still relatively active. Nonetheless, if the volume fell below the 40 days VMA level, the sustainability of the bullish sentiment would be questionable. (Study B)
Stochastic %D rose above 90% level, entered the short-term over-bought region. This suggested that the KLCI short-term movement has gone over-heated, and it is likely to have a technical correction. However, provided that the Stochastic could remained above 70% level, the market movement for the short-term is still bullish bias. (Study C)
Find this analysis useful? Why not share it with others? Click Here to send this to a friend
 1st Online Training In Malaysia |
 |
 |
 |
| View the Online Training | More Market Analysis | Find out more about WinChart | Upcoming Events |
Straits Index (M)
Sdn Bhd
No. 16, Jalan LP 1A / 5, Lestari Perdana,
43300 Seri Kembangan, Selangor
Hotline: (03) 8941 6828 (5
lines) Fax: (03) 8941 9828
Email: info@straitsindex.com
© Copyright 1997-2007 Straits Index (M) Sdn Bhd All
rights reserved