
| We
are an approved Securities Industry Development Corporation (SIDC)-CPE Training Provider. the training and development arm of the Securities Commission Malaysia (SC). |
 |
|
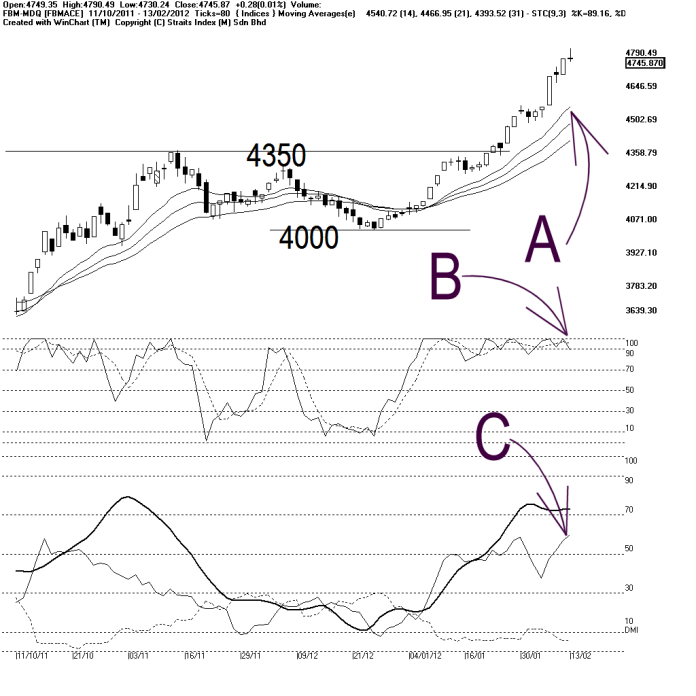
On Monday, the FBMACE had its intra-day high reaching 4790.49 points, but only managed to close at 4745.87 points. Gaining only 0.28 of a point. The FBMACE is forming a long upper shadow candlestick again, and this suggests a possible pullback for the FBMACE. Nevertheless, as indicated by A, the 14, 21, 31 EMA is still serving as the dynamic support to the FBMACE. As indicated by B, the Stochastic remains above 70% level, in the short term bullish territory. This suggests that the short term movement of the FBMACE is still positive. If the Stochastic should break below 70%, it would be a signal suggesting a beginning of a technical correcting. As indicated by C, the DMI +DI line is still rising, while staying above the -DI line. This suggests that the uptrend of the FBMACE is still intact, or the FBMACE is sill trending in its bullish territory. In conclusion, despite showing sign of over-heating, and a chance of pull-back, the uptrend of the FBMACE remains intact, and as long as the FBMACE could remain supported by the 14, 21, 31 EMA, the technical outlook is still positive. |
Straits Index (M)
Sdn Bhd
No. 16, Jalan LP 1A / 5, Lestari Perdana,
43300 Seri Kembangan, Selangor
Hotline: (03) 8941 6828 (5
lines) Fax: (03) 8941 9828
Email: info@straitsindex.com
© Copyright 1997-2010 Straits Index (M) Sdn Bhd All
rights reserved