WinChart Technical Analysis
Daily Market Analysis
| We
are an approved Securities Industry Development Corporation (SIDC)-CPE Training Provider. the training and development arm of the Securities Commission Malaysia (SC). |
|||
 |
 |
||
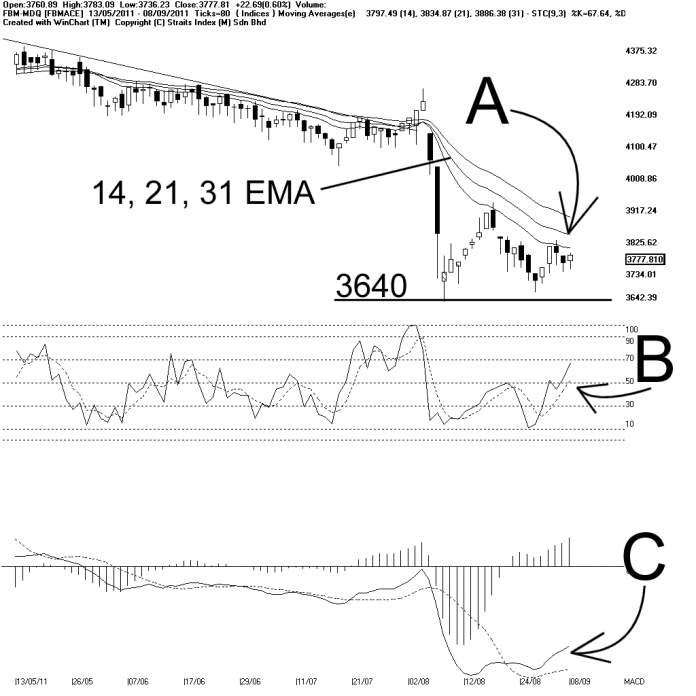
As indicated by A, the FBMACE technically rebounded 22.69 points or 0.6% on Wednesday, but still unable to break above the 14, 21 ,31 EMA dynamic resistance. Therefore, this suggests that the downtrend is still intact. Support for the FBMACE remains at 3640.
As indicated by B, the Stochastic breaks above 50%, and heading towards 70%. If the Stochastic could break above 70%, and stay above 70%, the short term movement of the FBMACE is expected to improve.
As the downside volatility of the FBMACE is gradually decreasing, the MACD histogram continues to climb, and this suggests that the short term movement of the FBMACE is showing a slight improvement, but as indicated by C, the MACD line remains below zero level, and this suggests that the mid to long term movement of the FBMACE is still weak.
In short, some improvement in the short term movement of the FBMACE, but until now, the downtrend of the FBMACE remains intact, and technical outlook is still negative, as the FBMACE is still resisted by the 14, 21, 31 EMA dynamic resistance.
Find this analysis useful? Why not share it with others? Click Here to send this to a friend
 1st Online Training In Malaysia |
 |
 |
 |
| View the Online Training | More Market Analysis | Find out more about WinChart | Upcoming Events |
Straits Index (M)
Sdn Bhd
No. 16, Jalan LP 1A / 5, Lestari Perdana,
43300 Seri Kembangan, Selangor
Hotline: (03) 8941 6828 (5
lines) Fax: (03) 8941 9828
Email: info@straitsindex.com
© Copyright 1997-2010 Straits Index (M) Sdn Bhd All
rights reserved