WinChart Technical Analysis
Daily Market Analysis
| We
are an approved Securities Industry Development Corporation (SIDC)-CPE Training Provider. the training and development arm of the Securities Commission Malaysia (SC). |
|||
 |
 |
||
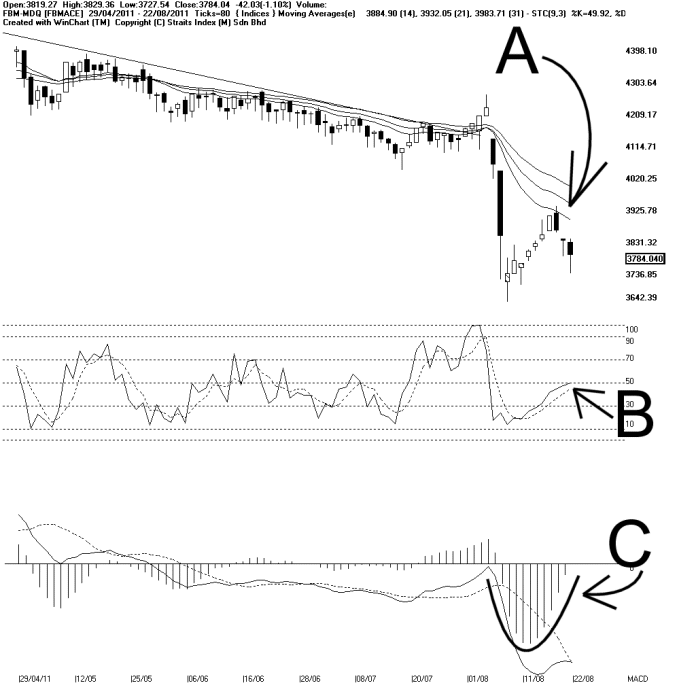
As indicated by A, the FBMACE continue its falling on Monday, after forming a Lower-High last week, when resisted by the 14, 21, 31 EMA dynamic resistance. The FBMACE fell 42.03 points or 1.1%. Support for the FBMACE remains at 3640 while the resistance is 4000.
As indicated by B, the Stochastic is touching 50%, and thus showing a short term neutral signal. The Stochastic is not able to signal any bullish or bearish short term tendency of the FBMACE for now.
As indicated by C, the MACD histogram is still rising, thus not showing that the FBMACE is losing strength. However, the MACD line stays below zero level, suggesting that the mid to long term movement of the FBMACE is still weak.
There are some conflicts of signal from technical indicators at the moment, and it is due to the sharp loss of the FBMACE on the 8th of August, and the value of these technical indicators (i.e MACD) is not yet reflecting the true movement of the FBMACE. Therefore, the priority of the analysis should be based on the price (or index) movement. With the FBMACE forming a Lower-High, coupled with the resistance of the dynamic resistance, the FBMACE downtrend is still intact, and the technical outlook for the FBMACE remains weak.
Find this analysis useful? Why not share it with others? Click Here to send this to a friend
 1st Online Training In Malaysia |
 |
 |
 |
| View the Online Training | More Market Analysis | Find out more about WinChart | Upcoming Events |
Straits Index (M)
Sdn Bhd
No. 16, Jalan LP 1A / 5, Lestari Perdana,
43300 Seri Kembangan, Selangor
Hotline: (03) 8941 6828 (5
lines) Fax: (03) 8941 9828
Email: info@straitsindex.com
© Copyright 1997-2010 Straits Index (M) Sdn Bhd All
rights reserved