WinChart Technical Analysis
Daily Market Analysis
| We
are an approved Securities Industry Development Corporation (SIDC)-CPE Training Provider. the training and development arm of the Securities Commission Malaysia (SC). |
|||
 |
 |
||
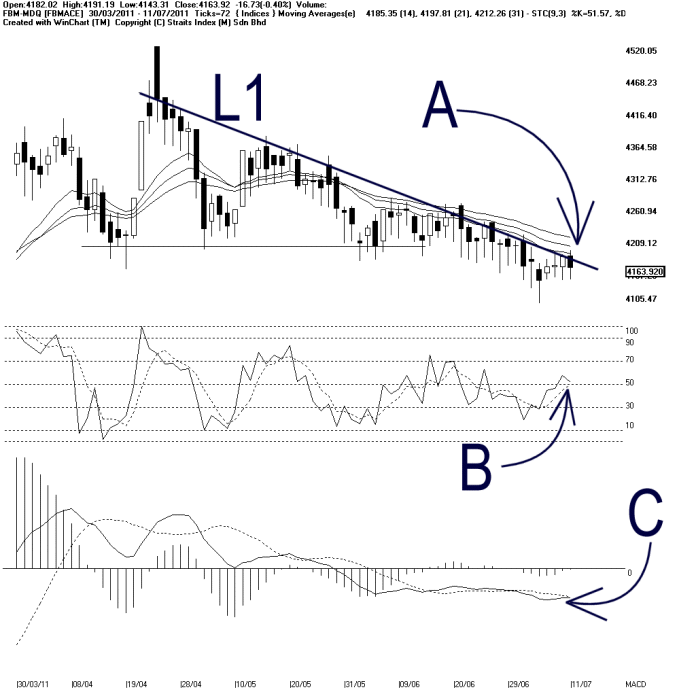
After rebounded for several days, the FBMACE was resisted by the 14, 21, 31 EMA as well as the L1 downtrend again on Monday, losing 16.73 points or 0.4%, as indicated by A. This suggests that the downtrend of the FBMACE is still intact.
As indicated by B, the Stochastic stays around 50%, in the neutral region, while not suggesting any direction for the FBMACE. If the Stochastic should fall below 30%, it would be a short term bearish signal for the FBMACE.
On Monday, the MACD histogram stopped rising, thus not yet forming a valid Rounding Bottom. Meanwhile, as indicated by C, the MACD line remains below the zero line, suggesting that the mid to long term movement of the FBMACE is still weak.
In conclusion, the downtrend of the FBMACE remains intact, as long as the FBMACE is still resisted by the L1 downtrend line or the 14, 21, 31 EMA dynamic resistance. With the negative technical outlook, the FBMACE is looking for the support at 4113 WinChart Automatic Fibonacci Retracement followed by the 4000 psychological level.
Find this analysis useful? Why not share it with others? Click Here to send this to a friend
 1st Online Training In Malaysia |
 |
 |
 |
| View the Online Training | More Market Analysis | Find out more about WinChart | Upcoming Events |
Straits Index (M)
Sdn Bhd
No. 16, Jalan LP 1A / 5, Lestari Perdana,
43300 Seri Kembangan, Selangor
Hotline: (03) 8941 6828 (5
lines) Fax: (03) 8941 9828
Email: info@straitsindex.com
© Copyright 1997-2010 Straits Index (M) Sdn Bhd All
rights reserved