WinChart Technical Analysis
Daily Market Analysis
| We
are an approved Securities Industry Development Corporation (SIDC)-CPE Training Provider. the training and development arm of the Securities Commission Malaysia (SC). |
|||
 |
 |
||
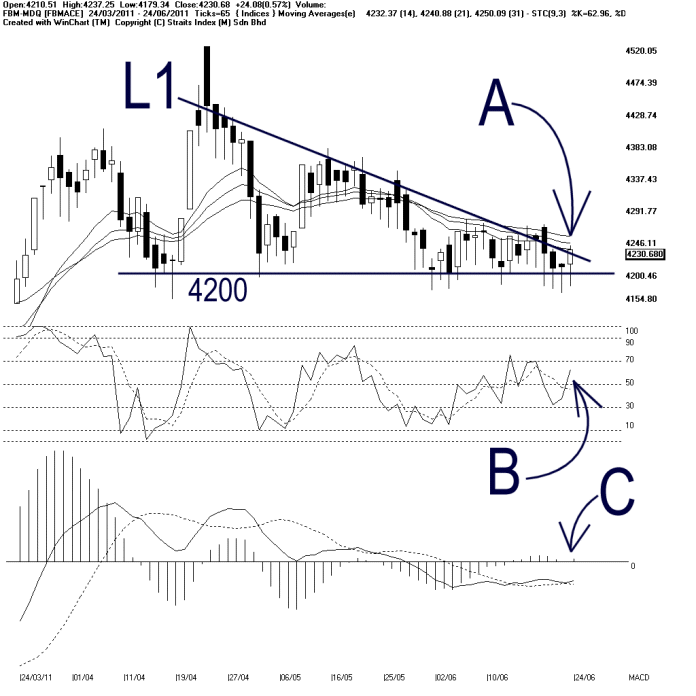
As indicated by B, the Stochastic rebounded on Friday, but not yet breaking above 70%. If the Stochastic should break above 70%, it would be a short term bullish signal for the FBMACE.
As indicated by C, the MACD histogram stopped falling on Friday, and if the MACD histogram should begin to tick up, it suggests that the FBMACE is picking up some strength again.
In short, despite rebounding from the 4200 level, the FBMACE technical outlook remains negative. Unless the FBMACE could successfully break above the L1 line and the 14, 21, 31 EMA.
Find this analysis useful? Why not share it with others? Click Here to send this to a friend
 1st Online Training In Malaysia |
 |
 |
 |
| View the Online Training | More Market Analysis | Find out more about WinChart | Upcoming Events |
Straits Index (M)
Sdn Bhd
No. 16, Jalan LP 1A / 5, Lestari Perdana,
43300 Seri Kembangan, Selangor
Hotline: (03) 8941 6828 (5
lines) Fax: (03) 8941 9828
Email: info@straitsindex.com
© Copyright 1997-2010 Straits Index (M) Sdn Bhd All
rights reserved