WinChart Technical Analysis
Daily Market Analysis
| We
are an approved Securities Industry Development Corporation (SIDC)-CPE Training Provider. the training and development arm of the Securities Commission Malaysia (SC). |
|||
 |
 |
||
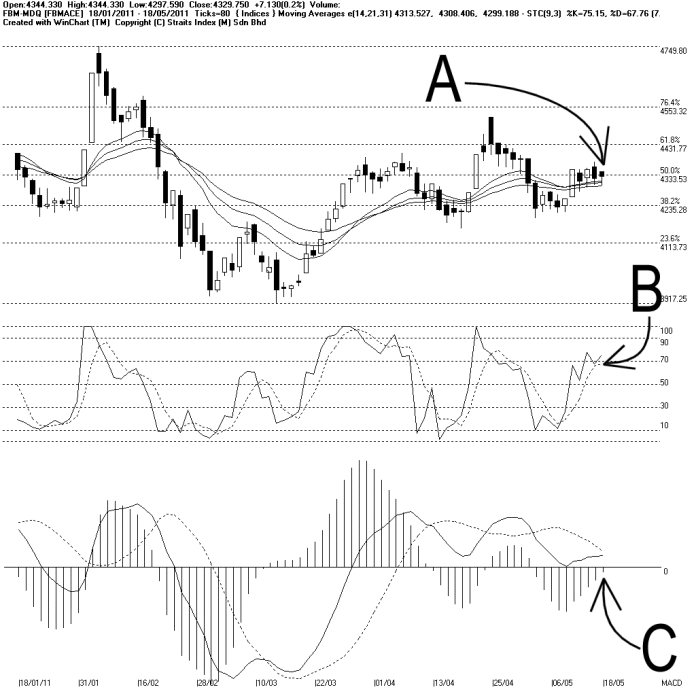
As indicated by B, the Stochastic rebounded and broke above 70%, re-entering the short term bullish territory. If the Stochastic could stay above 70%, it suggests that the short term movement of the FBMACE is still positive.
As indicated by C, the MACD histogram is still rising, thus showing a Rounding Bottom. The rising of the MACD histogram suggests that the FBMACE is picking up strength, and the improvement is expected to carry on until the MACD histogram should form a Rounding Top.
In short, despite positive signals from technical indicators, the FBMACE remains trendless. Again, the FBMACE has not shown any higher-Low, nor breaking new high, thus not yet forming an uptrend.
Find this analysis useful? Why not share it with others? Click Here to send this to a friend
 1st Online Training In Malaysia |
 |
 |
 |
| View the Online Training | More Market Analysis | Find out more about WinChart | Upcoming Events |
Straits Index (M)
Sdn Bhd
No. 16, Jalan LP 1A / 5, Lestari Perdana,
43300 Seri Kembangan, Selangor
Hotline: (03) 8941 6828 (5
lines) Fax: (03) 8941 9828
Email: info@straitsindex.com
© Copyright 1997-2010 Straits Index (M) Sdn Bhd All
rights reserved