WinChart Technical Analysis
Daily Market Analysis
| We
are an approved Securities Industry Development Corporation (SIDC)-CPE Training Provider. the training and development arm of the Securities Commission Malaysia (SC). |
|||
 |
 |
||
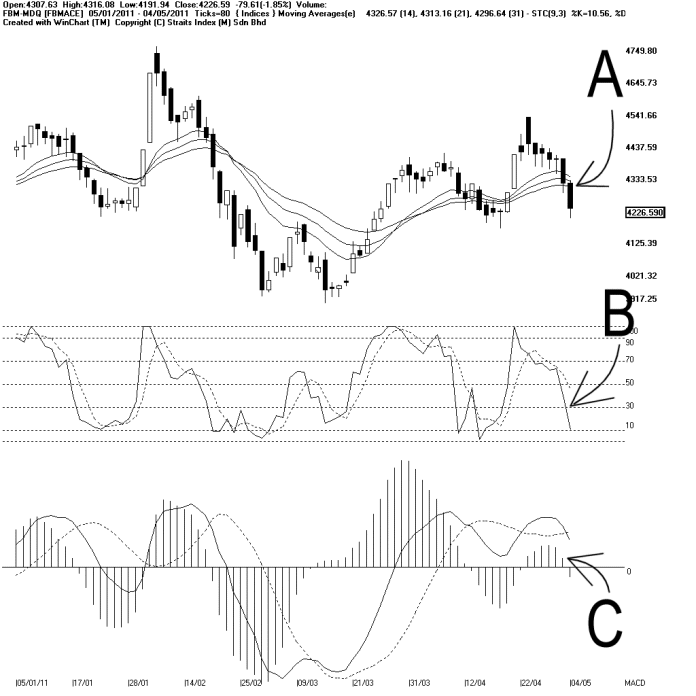
As indicated by B, the Stochastic breaks below 30%, entering the short term bearish territory. If the Stochastic should stay below 30%, the short term movement of the FBMACE is expected to be weak.
As indicated by C, the MACD histogram is still falling, thus still showing a Rounding Top. The falling of the MACD histogram suggests that the FBMACE is still losing strength, and the weakness shall carry on until the MACD histogram should form a rounding Bottom.
In conclusion, the FBMACE failed to form a Higher-low, thus failing to extent its short term uptrend. However, this does not mean that the FBMACE is forming a downtrend now, not until it forms a Lower-High. Technically, after forming a lower-High, the FBMACE would have to break below a recent support, then only counts as a downtrend formation.
Find this analysis useful? Why not share it with others? Click Here to send this to a friend
 1st Online Training In Malaysia |
 |
 |
 |
| View the Online Training | More Market Analysis | Find out more about WinChart | Upcoming Events |
Straits Index (M)
Sdn Bhd
No. 16, Jalan LP 1A / 5, Lestari Perdana,
43300 Seri Kembangan, Selangor
Hotline: (03) 8941 6828 (5
lines) Fax: (03) 8941 9828
Email: info@straitsindex.com
© Copyright 1997-2010 Straits Index (M) Sdn Bhd All
rights reserved