WinChart Technical Analysis
Daily Market Analysis
| We
are an approved Securities Industry Development Corporation (SIDC)-CPE Training Provider. the training and development arm of the Securities Commission Malaysia (SC). |
|||
 |
 |
||
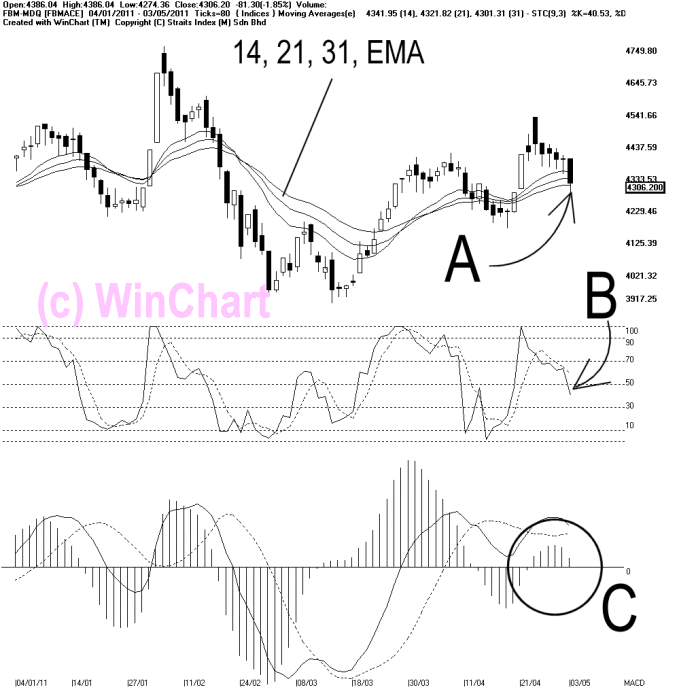
As indicated by B, the Stochastic breaks below 50% by margin, and this suggests that the FBMACE short term is still losing strength. If the Stochastic should break below 30%, it would be a short term bearish biased signal for the FBMACE.
As circled at C, the MACD histogram is falling, thus forming a Rounding Top. The falling of the MACD histogram suggests that the FBMACE short term movement is losing strength.
In short, the FBMACE failed to rebound from the 14, 21, 31 EMA, and therefore, it has not formed a higher-low. If the FBMACE should break below 14, 21, 31 EMA, the technical outlook for the FBMACE would turn to slightly negative, but it does not mean that the FBMACE is forming a downtrend immediately.
Find this analysis useful? Why not share it with others? Click Here to send this to a friend
 1st Online Training In Malaysia |
 |
 |
 |
| View the Online Training | More Market Analysis | Find out more about WinChart | Upcoming Events |
Straits Index (M)
Sdn Bhd
No. 16, Jalan LP 1A / 5, Lestari Perdana,
43300 Seri Kembangan, Selangor
Hotline: (03) 8941 6828 (5
lines) Fax: (03) 8941 9828
Email: info@straitsindex.com
© Copyright 1997-2010 Straits Index (M) Sdn Bhd All
rights reserved