WinChart Technical Analysis
Daily Market analysis
| We
are an approved Securities Industry Development Corporation (SIDC)-CPE Training Provider. the training and development arm of the Securities Commission Malaysia (SC). |
|||
 |
 |
||
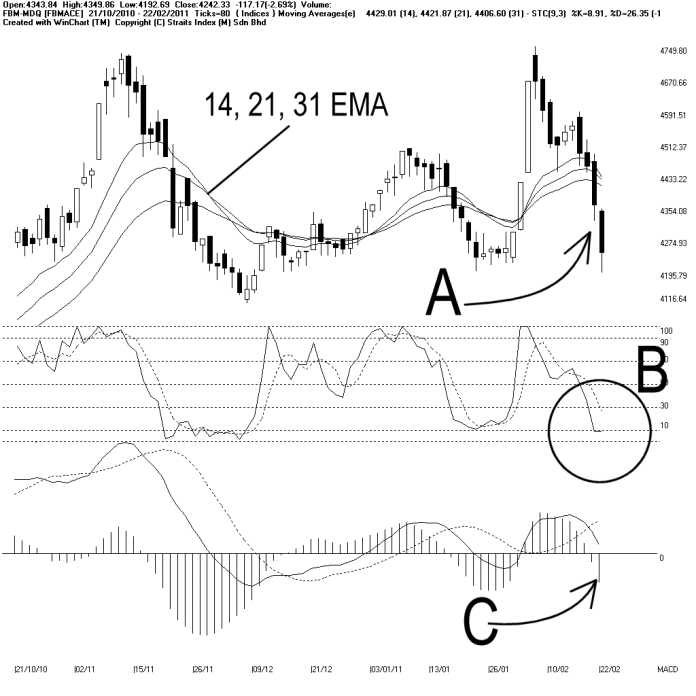
Meanwhile, the Bollinger Bands expanded 31%, with the FBMACE below the Bollinger Middle Band. This suggests a bearish signal for the FBMACE, and if the Bollinger Bands should continue its expansion with the FBMACE below the Bollinger Middle Band, more down side movement is expected for the FBMACE.
As circled at B, the Stochastic remains below 30%, in the short term bearish territory, and this suggests that the short term market movement for the FBMACE is bearish bias, until the Stochastic could successfully breaks above 30%.
As indicated by C, the MACD histogram is still falling, and the falling of the MACD histogram suggests that the FBMACE is still losing strength, thus the weakening movement of the FBMACE is expected to continue, until the MACD histogram should form a Rounding Bottom.
Technically, when the FBMACE is below the 14, 21, 31 EMA, the technical outlook is expected to be on the negative side. However, the FBMACE is currently testing the 4199 WinChart Automatic Fibonacci Retracement, which is a support for the FBMACE since 2010 December, and the FBMACE managed to rebound few times at this level. If the FBMACE should break below this level, the next support is seen at 4070.
Find this analysis useful? Why not share it with others? Click Here to send this to a friend
 1st Online Training In Malaysia |
 |
 |
 |
| View the Online Training | More Market Analysis | Find out more about WinChart | Upcoming Events |
Straits Index (M)
Sdn Bhd
No. 16, Jalan LP 1A / 5, Lestari Perdana,
43300 Seri Kembangan, Selangor
Hotline: (03) 8941 6828 (5
lines) Fax: (03) 8941 9828
Email: info@straitsindex.com
© Copyright 1997-2010 Straits Index (M) Sdn Bhd All
rights reserved