WinChart Technical Analysis
Daily Market analysis
| We
are an approved Securities Industry Development Corporation (SIDC)-CPE Training Provider. the training and development arm of the Securities Commission Malaysia (SC). |
|||
 |
 |
||
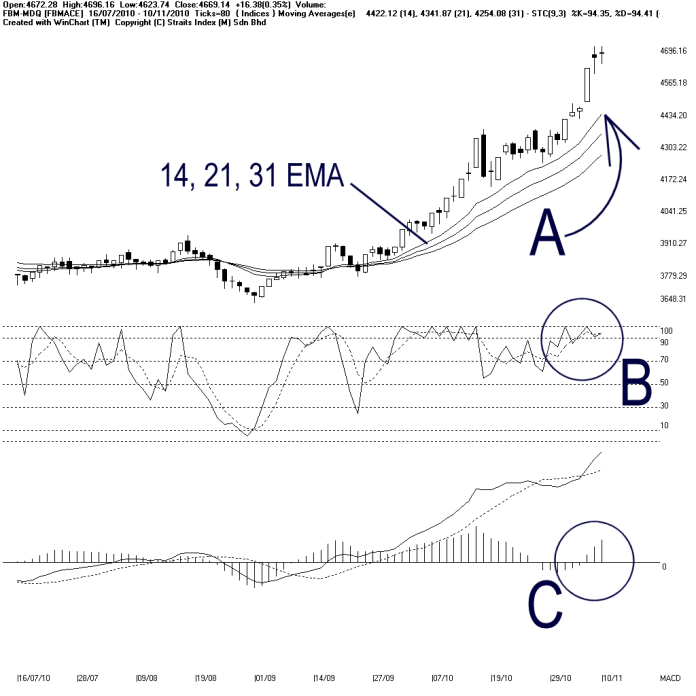
Meanwhile, the Bollinger Bands expanded only 12%, and when compared to the previous expansion rate, it appears that the Bollinger Bands could be contracting. If the Bollinger Bands should contract, it would be a signal suggesting a consolidation for the FBMACE.
As circled at B, the Stochastic remains above 70%, in the short term bullish region. This suggests that the FBMACE short term movement is still bullish bias. If the Stochastic should break below 70%, it would be a signal suggesting a beginning of a technical correction.
As circled at C, the MACD histogram is still rising, and therefore, it has not formed a Rounding Top. Technically, provided that the FBMACE is still rising, it suggests that the FBMACE is still picking up strength.
In conclusion, the FBMACE uptrend remains intact, but might be having a technical correction or a a consolidation. But if the FBMACE should rebound from the 14, 21, 31 EMA after its consolidation or its technical correction, the technical outlook for the FBMACE shall remain positive.
Find this analysis useful? Why not share it with others? Click Here to send this to a friend
 1st Online Training In Malaysia |
 |
 |
 |
| View the Online Training | More Market Analysis | Find out more about WinChart | Upcoming Events |
Straits Index (M)
Sdn Bhd
No. 16, Jalan LP 1A / 5, Lestari Perdana,
43300 Seri Kembangan, Selangor
Hotline: (03) 8941 6828 (5
lines) Fax: (03) 8941 9828
Email: info@straitsindex.com
© Copyright 1997-2010 Straits Index (M) Sdn Bhd All
rights reserved