WinChart Technical Analysis
Daily Market analysis
| We
are an approved Securities Industry Development Corporation (SIDC)-CPE Training Provider. the training and development arm of the Securities Commission Malaysia (SC). |
|||
 |
 |
||
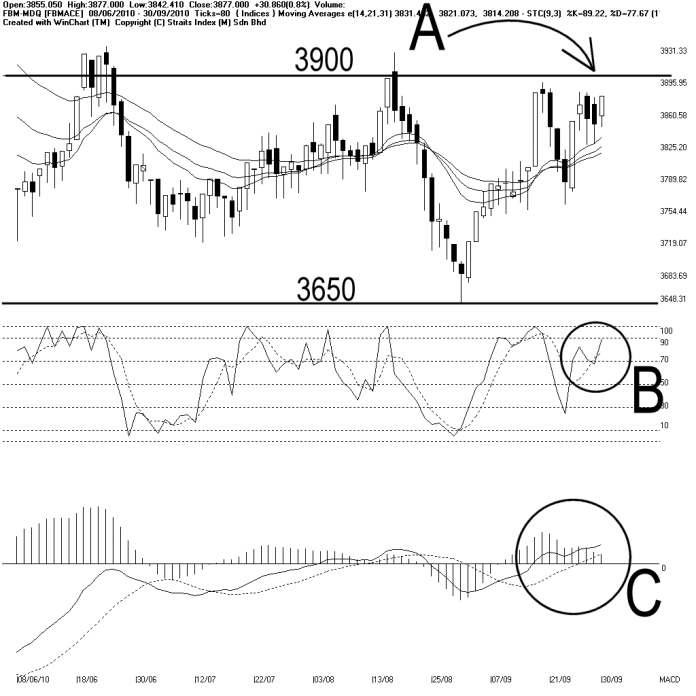
In addition, the Bollinger Bands contracted again, suggesting that the FBMACE is entering into a consolidation again, and the direction for the FBMACE is expected to be uncleared, until the re-expansion of the Bollinger Bands.
As circled at B, the Stochastic remains above 70%, in the short term bullish region, suggesting that the short term movement of the FBMACE is still bullish biased.
As circled at C, the MACD histogram is falling, and suggesting that the FBMACE is losing strength. Generally, the weakening short term move of the FBMACE is likely to carry on until the MACD histogram should form a Rounding Bottom.
During a sideways movement, it is rather common to see conflicting signals between indicators. In this case the MACD histogram is conflicting with the Stochastic signal. Therefore, the priority of the analysis should be based on Primary Indicators, or even best to refer to its price (Chart Patterns). In conclusion, chart pattern is showing a trading range, while the Bollinger Bands is showing a consolidation signal.
Find this analysis useful? Why not share it with others? Click Here to send this to a friend
 1st Online Training In Malaysia |
 |
 |
 |
| View the Online Training | More Market Analysis | Find out more about WinChart | Upcoming Events |
Straits Index (M)
Sdn Bhd
No. 16, Jalan LP 1A / 5, Lestari Perdana,
43300 Seri Kembangan, Selangor
Hotline: (03) 8941 6828 (5
lines) Fax: (03) 8941 9828
Email: info@straitsindex.com
© Copyright 1997-2010 Straits Index (M) Sdn Bhd All
rights reserved