WinChart Technical Analysis
Daily Market analysis
| We
are an approved Securities Industry Development Corporation (SIDC)-CPE Training Provider. the training and development arm of the Securities Commission Malaysia (SC). |
|||
 |
 |
||
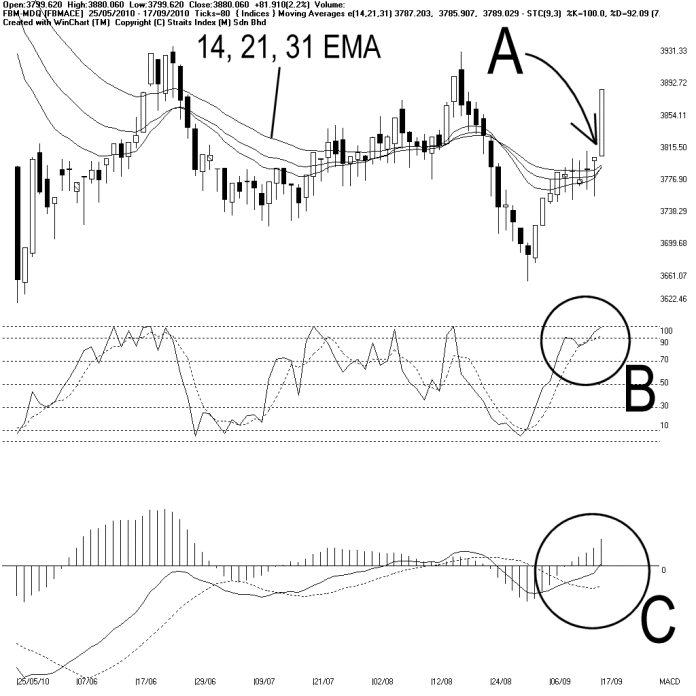
Meanwhile, the Bollinger Bands expanded 28%, with the FBMACE above the Bollinger Middle Band, this suggests that the upside volatility of the FBMACE is increasing, thus a positive signal for the FBMACE.
As circled at B, the Stochastic rose and remain above 70%, thus suggesting that the short term movement of the FBMACE is still bullish biased. If the Stochastic should break below 70%, it would be a signal suggesting a beginning of a technical correction.
As circled at C, the MACD Histogram is still rising, suggesting that the FBMACE is gaining strength, and the positive signal shall remain in place until the MACD histogram should form a Rounding Top.
In short, technical outlook for the FBMACE turns positive with the FBMACE above the 14, 21, 31 EMA, and the FBMACE is set to test the 3892~3900 resistance, if it could break above this resistance level, it would most likely form an uptrend.
Find this analysis useful? Why not share it with others? Click Here to send this to a friend
 1st Online Training In Malaysia |
 |
 |
 |
| View the Online Training | More Market Analysis | Find out more about WinChart | Upcoming Events |
Straits Index (M)
Sdn Bhd
No. 16, Jalan LP 1A / 5, Lestari Perdana,
43300 Seri Kembangan, Selangor
Hotline: (03) 8941 6828 (5
lines) Fax: (03) 8941 9828
Email: info@straitsindex.com
© Copyright 1997-2010 Straits Index (M) Sdn Bhd All
rights reserved