WinChart Technical Analysis
Daily Market analysis
| We
are an approved Securities Industry Development Corporation (SIDC)-CPE Training Provider. the training and development arm of the Securities Commission Malaysia (SC). |
|||
 |
 |
||
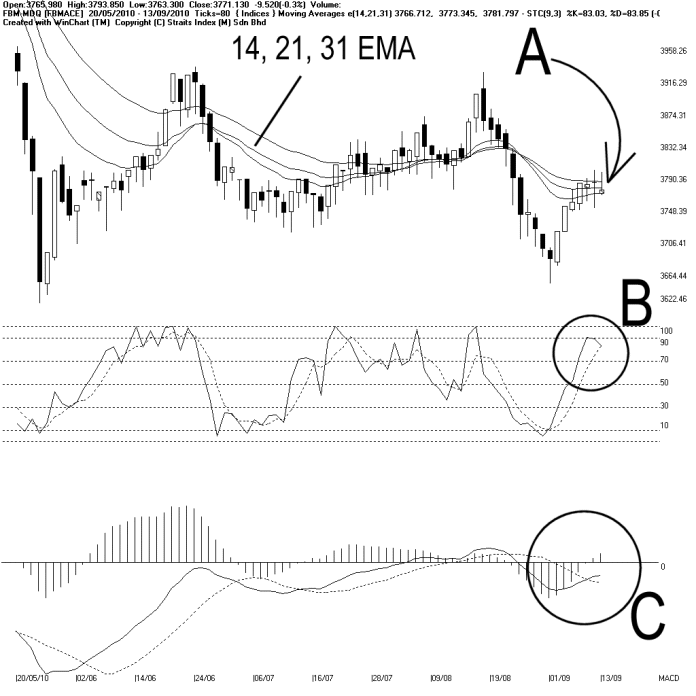
Meanwhile, the Bollinger Bands expanded 4%, with the FBMACE above the Bollinger Middle Band. This suggests that the FBMACE might be turning positive, but the Bollinger Bands has to expand further to confirm the signal.
As circled at B, the Stochastic is falling, but above 70%, thus the short term bullish signal is still intact. In short, the short term bullish signal shall remains in place, until the Stochastic should break below 70%.
As circled at C, the MACD histogram is still rising, suggesting that the FBMACE is still picking up strength, and the improvement of the FBMACE is expected to carry on until the MACD histogram should form a Rounding Top.
In conclusion, technical indicators are suggesting improvement signal for the FBMACE, but the FBMACE is still resisted by the 14, 21, 31 EMA, thus the downtrend is still intact. Nevertheless, if the Bollinger Bands should continue to expand with the FBMACE above the Bollinger Middle Band, more upside movement is likely for the FBMACE.
Find this analysis useful? Why not share it with others? Click Here to send this to a friend
 1st Online Training In Malaysia |
 |
 |
 |
| View the Online Training | More Market Analysis | Find out more about WinChart | Upcoming Events |
Straits Index (M)
Sdn Bhd
No. 16, Jalan LP 1A / 5, Lestari Perdana,
43300 Seri Kembangan, Selangor
Hotline: (03) 8941 6828 (5
lines) Fax: (03) 8941 9828
Email: info@straitsindex.com
© Copyright 1997-2010 Straits Index (M) Sdn Bhd All
rights reserved