WinChart Technical Analysis
Daily Market analysis
| We
are an approved Securities Industry Development Corporation (SIDC)-CPE Training Provider. the training and development arm of the Securities Commission Malaysia (SC). |
|||
 |
 |
||
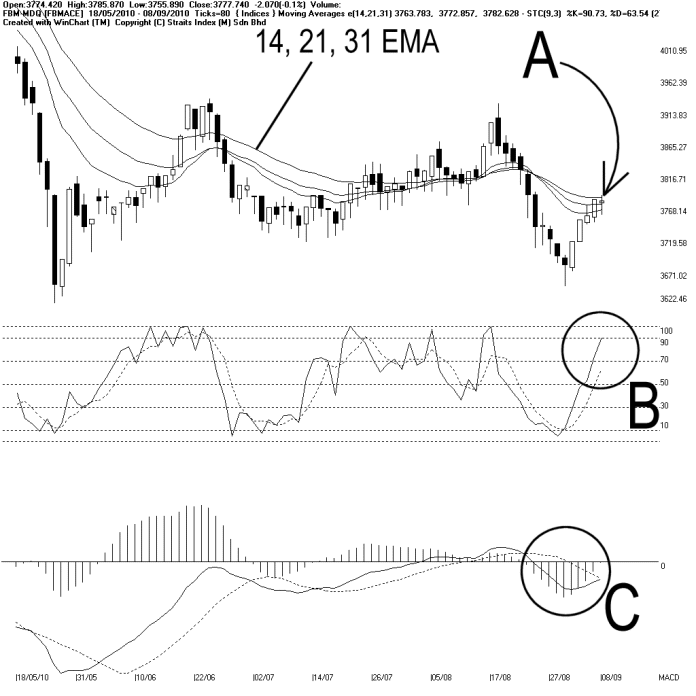
Meanwhile, the Bollinger Bands is still contracting, suggesting that the FBMACE is still consolidating. Other than suggesting a consolidation signal, the contraction of the Bollinger Bands also imply that the FBMACE is preparing for a new movement, and the direction of the new movement shall only be revealed once the Bollinger Bands re-expanded.
As circled at B, the Stochastic remains above 70%, in the short term bullish region. This suggests that the short term movement of the FBMACE is now bullish, unless the Stochastic should fall below 70% level again.
As circled at C, the MACD histogram is still rising, while the Rounding Bottom is still in-sight. The rising of the MACD histogram suggests that the short term movement of the FBMACE is improving, thus the improvement is expected to carry on until the MACD histogram should form a Rounding Top. Meanwhile, the MACD line is still below zero level, suggesting that the mid to long term movement of the FBMACE is still weak.
In conclusion, the FBMACE has not broken away from its downtrend, with the 14, 21, 31 EMA still serving as the dynamic resistance. If the FBMACE should start falling again, it would form a Lower-high, and the downtrend shall remain intact.
Find this analysis useful? Why not share it with others? Click Here to send this to a friend
 1st Online Training In Malaysia |
 |
 |
 |
| View the Online Training | More Market Analysis | Find out more about WinChart | Upcoming Events |
Straits Index (M)
Sdn Bhd
No. 16, Jalan LP 1A / 5, Lestari Perdana,
43300 Seri Kembangan, Selangor
Hotline: (03) 8941 6828 (5
lines) Fax: (03) 8941 9828
Email: info@straitsindex.com
© Copyright 1997-2010 Straits Index (M) Sdn Bhd All
rights reserved