WinChart Technical Analysis
Daily Market analysis
| We
are an approved Securities Industry Development Corporation (SIDC)-CPE Training Provider. the training and development arm of the Securities Commission Malaysia (SC). |
|||
 |
 |
||
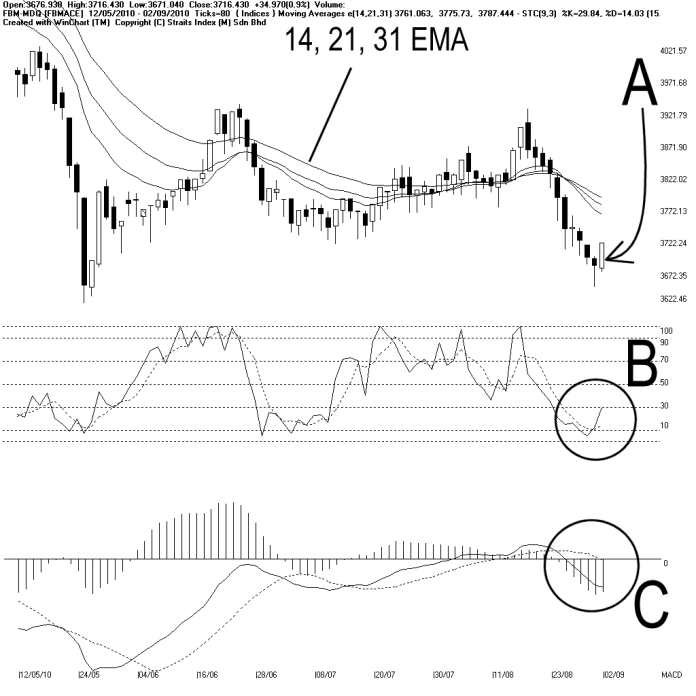
Meanwhile, the Bollinger Bands contracted 11%, suggesting that the FBMACE is consolidating. However, with the FBMACE below the Bollinger Middle Band, the immediate technical outlook is still weak. Support for the FBMACE is at 3622 WinChart Automatic Fibonacci Retracement while the resistance remains at the 14, 21, 31 EMA dynamic resistance.
As circled at B, the Stochastic rebounded and testing 30%. If the Stochastic could break above 30%, it would be a signal suggesting a beginning of a technical rebound. However, the Stochastic has to break above 70%, in order to signal a short term bullish movement for the FBMACE.
As circled at C, the MACD histogram ticked higher, and it might be forming a Rounding Bottom. If the MACD histogram could form a Rounding Bottom, it would suggest that the FBMACE is gradually regaining some strength.
In short, after falling for more than 2 weeks, the FBMACE is having a technical rebound, but since the 14, 21, 31 EMA dynamic resistance remains intact, the downtrend is still in place. All rebound below the dynamic resistance can only be considered as a technical rebound, not a reversal signal.
Find this analysis useful? Why not share it with others? Click Here to send this to a friend
 1st Online Training In Malaysia |
 |
 |
 |
| View the Online Training | More Market Analysis | Find out more about WinChart | Upcoming Events |
Straits Index (M)
Sdn Bhd
No. 16, Jalan LP 1A / 5, Lestari Perdana,
43300 Seri Kembangan, Selangor
Hotline: (03) 8941 6828 (5
lines) Fax: (03) 8941 9828
Email: info@straitsindex.com
© Copyright 1997-2010 Straits Index (M) Sdn Bhd All
rights reserved