WinChart Technical Analysis
Daily Market analysis
| We
are an approved Securities Industry Development Corporation (SIDC)-CPE Training Provider. the training and development arm of the Securities Commission Malaysia (SC). |
|||
 |
 |
||
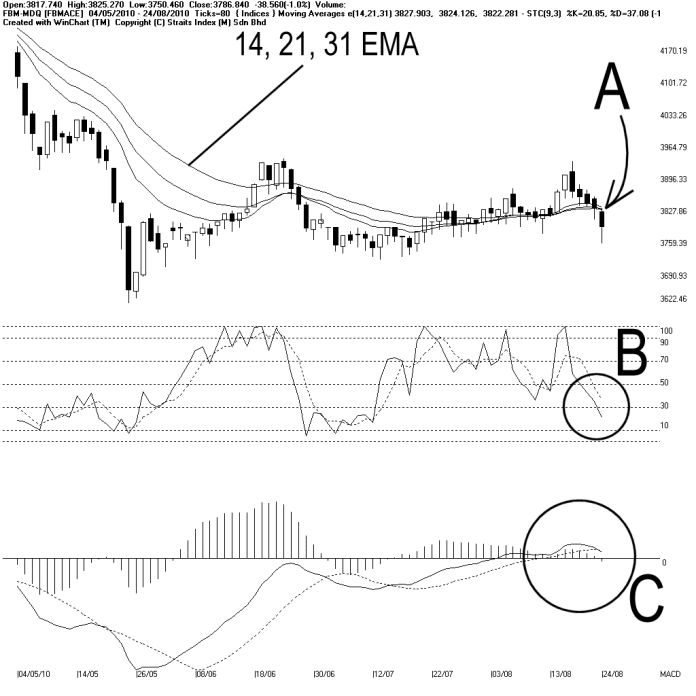
Meanwhile, the Bollinger Bands expanded 12%, with the FBMACE below the Bollinger Middle Band. Therefore, the Bollinger Bands is now showing a bearish biased signal. If the Bollinger Bands should continue to expand, while the FBMACE is still below the Bollinger Middle Band, more downside movement for the FBMACE is expected.
As circled at B, the Stochastic fell below 30%, entering the short term bearish territory. Technically, if the Stochastic should stay below 30%, the technical outlook for the short term is expected to be bearish biased.
As circled at C, the MACD histogram is still falling, suggesting that the FBMACE is still losing strength. The weakening movement of the FBMACE is expected to continue until the MACD histogram should form a Rounding Bottom.
In short, the technical outlook for the FBMACE turns negative as the FBMACE fell below the 14, 21, 31 EMA. With the 14, 21, 31 EMA serving as the dynamic resistance, there is a risk of forming a downtrend for the FBMACE.
Find this analysis useful? Why not share it with others? Click Here to send this to a friend
 1st Online Training In Malaysia |
 |
 |
 |
| View the Online Training | More Market Analysis | Find out more about WinChart | Upcoming Events |
Straits Index (M)
Sdn Bhd
No. 16, Jalan LP 1A / 5, Lestari Perdana,
43300 Seri Kembangan, Selangor
Hotline: (03) 8941 6828 (5
lines) Fax: (03) 8941 9828
Email: info@straitsindex.com
© Copyright 1997-2010 Straits Index (M) Sdn Bhd All
rights reserved