WinChart Technical Analysis
Daily Market analysis
| We
are an approved Securities Industry Development Corporation (SIDC)-CPE Training Provider. the training and development arm of the Securities Commission Malaysia (SC). |
|||
 |
 |
||
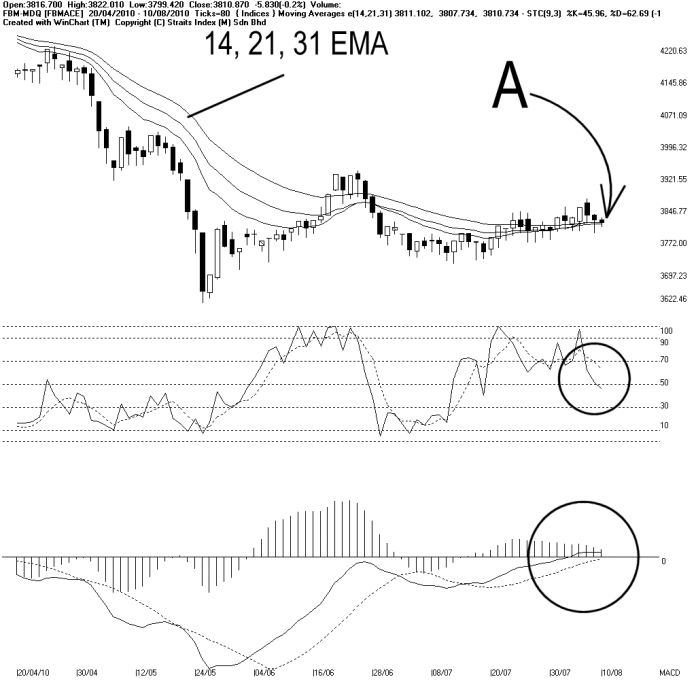
Meanwhile, the Bollinger Bands is still contracting, suggesting that the FBMACE is still consolidating and preparing for its new movement. The direction of the new movement shall be determined by the relative position of the FBMACE above or below the Bollinger Middle Band when the Bollinger Bands re-expands.
As circled at B, the Stochastic breaks below 50%, suggesting that the short term movement for the FBMACE is still weakening, but technically, the Stochastic has to break below 30%, in order to show a short term bearish signal.
As circled at C, the MACD histogram is still falling, suggesting that the FBMACE is still losing strength. The weakening movement of the FBMACE is expected to carry on, until the MACD histogram should form a Rounding Bottom.
In conclusion, despite weakening signals from the Stochastic and the MACD histogram, the FBMACE has not formed a downtrend yet, as the Bollinger Bands is still contracting. Therefore, we shall watch the development of the Bollinger Bands closely for any clue of the new movement.
Find this analysis useful? Why not share it with others? Click Here to send this to a friend
 1st Online Training In Malaysia |
 |
 |
 |
| View the Online Training | More Market Analysis | Find out more about WinChart | Upcoming Events |
Straits Index (M)
Sdn Bhd
No. 16, Jalan LP 1A / 5, Lestari Perdana,
43300 Seri Kembangan, Selangor
Hotline: (03) 8941 6828 (5
lines) Fax: (03) 8941 9828
Email: info@straitsindex.com
© Copyright 1997-2010 Straits Index (M) Sdn Bhd All
rights reserved