WinChart Technical Analysis
Daily Market analysis
| We
are an approved Securities Industry Development Corporation (SIDC)-CPE Training Provider. the training and development arm of the Securities Commission Malaysia (SC). |
|||
 |
 |
||
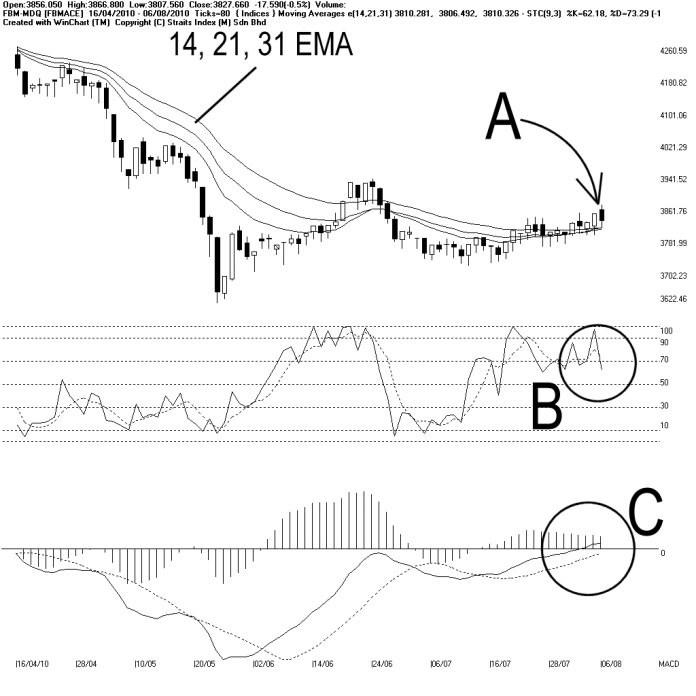
Meanwhile, the Bollinger Bands did not expanded much on Friday, and therefore, the upside momentum of the FBMACE failed to carry on. Nevertheless, support for the FBMACE remains at 3622 WinChart Automatic Fibonacci Retracement while the resistance is at 3891 WinChart Automatic Fibonacci Retracement.
As circled at B, the Stochastic breaks below 70%, thus the short term bullish signal has failed to sustain. The Stochastic has to return to above 70% in the immediate term, in order for the FBMACE to resumes its short term bullishness.
As circled at C, the MACD histogram is still now forming a Rounding Bottom, thus suggesting that the FBMACE is not gaining much strength yet.
In conclusion, the FBMACE rally has paused due to profit taking activities. However, with the FBMACE still supported by the Bollinger Middle Band as well as the 14, 21, 31 EMA, the immediate technical outlook is still bullish biased. If the Bollinger Bands should continue to expand while the FBMACE still stays above the Bollinger Middle Band, the rally would resume.
Find this analysis useful? Why not share it with others? Click Here to send this to a friend
 1st Online Training In Malaysia |
 |
 |
 |
| View the Online Training | More Market Analysis | Find out more about WinChart | Upcoming Events |
Straits Index (M)
Sdn Bhd
No. 16, Jalan LP 1A / 5, Lestari Perdana,
43300 Seri Kembangan, Selangor
Hotline: (03) 8941 6828 (5
lines) Fax: (03) 8941 9828
Email: info@straitsindex.com
© Copyright 1997-2010 Straits Index (M) Sdn Bhd All
rights reserved