WinChart Technical Analysis
Daily Market analysis
| We
are an approved Securities Industry Development Corporation (SIDC)-CPE Training Provider. the training and development arm of the Securities Commission Malaysia (SC). |
|||
 |
 |
||
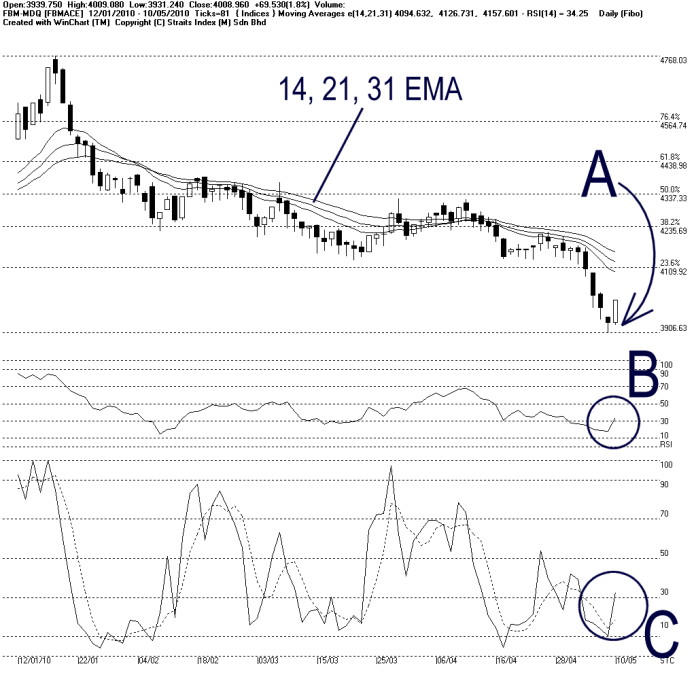
As indicated by A, the FBMACE rebounded after being supported by the 3906.3 WinChart Automatic Fibonacci Retracement, and therefore, the current support for the FBMACE is at 3900 (round up) WinChart Automatic Fibonacci Retracement while the resistance is at 4110 WinChart Automatic Fibonacci Retracement.
Despite the FBMACE rebounded, it is still staying below the 14, 21, 31 EMA, which is still serving as a dynamic resistance for the FBMACE. Therefore, the rebound on Monday was merely a technical rebound, not yet a reversal signal.
As circled at B, the WinChart RSI rebounded together with the FBMACE, breaking above 30% level, away from the mid term bearish territory. If the WinChart RSI should continue rising, it suggests that the mid term movement of the FBMACE is picking up some strength, and expected to consolidate.
As circled at C, the Stochastic also breaks above 30%, giving a short term technical rebound signal. If the Stochastic should continue rising, the technical rebound of the FBMACE is expected to carry on, but if the short term movement of the FBMACE were to return to bullish trend, the Stochastic would have to break above and maintain above 70% level.
In conclusion, the rebound of the FBMACE on Monday was very normal, for the FBMACE has been falling 5 days for the last week. However, if the FBMACE should remain resisted by the 14, 21, 31 EMA after this rebound, it means that the downtrend is still intact.
Find this analysis useful? Why not share it with others? Click Here to send this to a friend
 1st Online Training In Malaysia |
 |
 |
 |
| View the Online Training | More Market Analysis | Find out more about WinChart | Upcoming Events |
Straits Index (M)
Sdn Bhd
No. 16, Jalan LP 1A / 5, Lestari Perdana,
43300 Seri Kembangan, Selangor
Hotline: (03) 8941 6828 (5
lines) Fax: (03) 8941 9828
Email: info@straitsindex.com
© Copyright 1997-2010 Straits Index (M) Sdn Bhd All
rights reserved