WinChart Technical Analysis
Daily Market analysis
| We
are an approved Securities Industry Development Corporation (SIDC)-CPE Training Provider. the training and development arm of the Securities Commission Malaysia (SC). |
|||
 |
 |
||
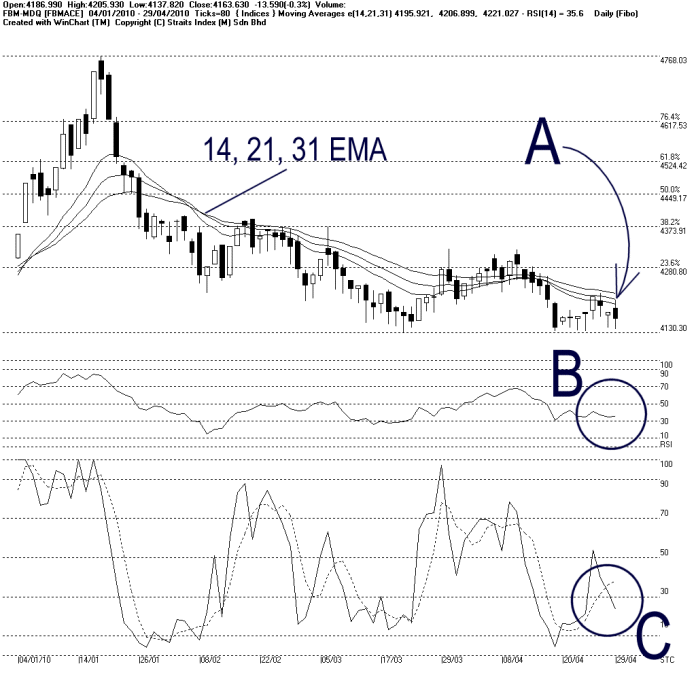
As shown on the chart above, the FBMACE tested the 14, 21, 31 EMA on Thursday, but remains resisted by the 14, 21, 31 EMA, and ended the day losing 13.59 points or 0.3%. This shows that the 14, 21, 31 EMA is still being the dynamic resistance for the FBMACE, thus the immediate technical outlook is still bearish biased.
Meanwhile, the Bollinger Bands contracted 15%, suggesting that the FBMACE is still consolidating while preparing for a new movement, and the unclear market movement shall carry on until the Bollinger Bands should re-expand. Resistance for the FBMACE remains at 4280 WinChart Automatic Fibonacci Retracement while the support is at 4130 WinChart Automatic Fibonacci Retracement.
As circled at B, the WinChart RSI is still moving in between 30% ~ 50% level, suggesting that the FBMACE is still consolidating with some weakness.
As circled at C, the Stochastic breaks below 30%, entering the short term bearish territory. If the Stochastic should remain below 30%, the market movement for the short term shall remains bearish biased.
In conclusion, the Stochastic is showing an early bearish signal. If the FBMACE should break below the 4130 support, together with the Bollinger Bands expanding, the FBMACE would form a downtrend.
Find this analysis useful? Why not share it with others? Click Here to send this to a friend
 1st Online Training In Malaysia |
 |
 |
 |
| View the Online Training | More Market Analysis | Find out more about WinChart | Upcoming Events |
Straits Index (M)
Sdn Bhd
No. 16, Jalan LP 1A / 5, Lestari Perdana,
43300 Seri Kembangan, Selangor
Hotline: (03) 8941 6828 (5
lines) Fax: (03) 8941 9828
Email: info@straitsindex.com
© Copyright 1997-2010 Straits Index (M) Sdn Bhd All
rights reserved