WinChart Technical Analysis
Daily Market analysis
| We
are an approved Securities Industry Development Corporation (SIDC)-CPE Training Provider. the training and development arm of the Securities Commission Malaysia (SC). |
|||
 |
 |
||
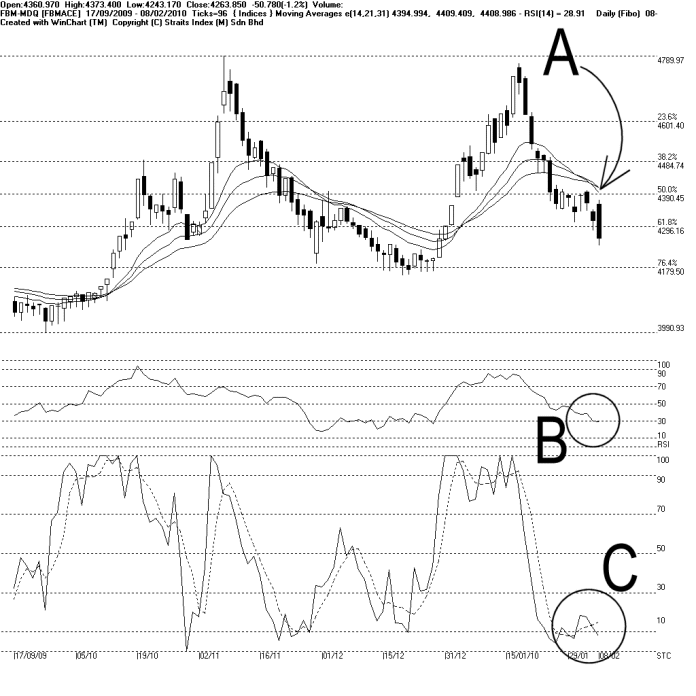
On Monday, the FBMACE broke below the 4296 WinChart Automatic Fibonacci Retracement, closing 50.78 points of 1.2%. Resistance for the FBMACE are found at 4296 WinChart Automatic Fibonacci Retracement and 4390 WinChart Automatic Fibonacci Retracement; while the next support is at 4180 WinChart Automatic Fibonacci Retracement.
As indicated by A, the 14, 21, 31 EMA is still falling while serving as the dynamic resistance for the FBMACE. Technically, provided that the FBMACE is still resisted by the falling dynamic resistance, the outlook for the FBMACE is expected to be weak.
As circled at B, the WinChart RSI is still below 30% level, which is the mid term bearish region. Therefore, this suggests that the FBMACE mid term strength is still weak, and provided that the WinChart RSI is still below 30% level, the mid term market sentiment is expected to weak.
As circled at C, the Stochastic is still below 30% level, which is the short term bearish region. Technically, provided that the Stochastic is below 30% level, the market movement for the short term is expected to be weak.
In conclusion, the downtrend for the FBMACE remains intact, as it is still resisted by the 14, 21, 31 EMA as well as the Bollinger Middle Band; and together with the WinChart RSI and Stochastic are also showing weaker signals.
Find this analysis useful? Why not share it with others? Click Here to send this to a friend
 1st Online Training In Malaysia |
 |
 |
 |
| View the Online Training | More Market Analysis | Find out more about WinChart | Upcoming Events |
Straits Index (M)
Sdn Bhd
No. 16, Jalan LP 1A / 5, Lestari Perdana,
43300 Seri Kembangan, Selangor
Hotline: (03) 8941 6828 (5
lines) Fax: (03) 8941 9828
Email: info@straitsindex.com
© Copyright 1997-2010 Straits Index (M) Sdn Bhd All
rights reserved