WinChart Technical Analysis
Daily Market analysis
| We
are an approved Securities Industry Development Corporation (SIDC)-CPE Training Provider. the training and development arm of the Securities Commission Malaysia (SC). |
|||
 |
 |
||
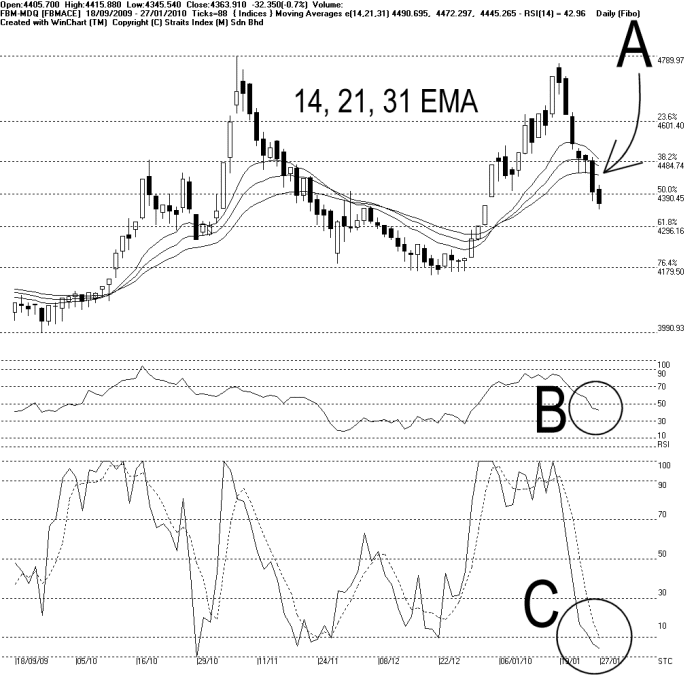
On Wednesday, the FBMACE ended lower and broke below the 4390 WinChart Automatic Fibonacci Retracement, to close at 4363.91 points, losing 32.35 points or 0.7%. Resistance for the FBMACE remains at 4485 WinChart Automatic Fibonacci Retracement followed by the 14, 21, 31 EMA dynamic resistance; while the support is now at 4296 WinChart Automatic Fibonacci Retracement.
As shown on the chart above, the FBMACE is still situated below the falling 14, 21, 31 EMA which serves as the dynamic resistance, and the FBMACE is about to form a downtrend, if it should failed to break above the dynamic resistance.
As circled at B, the WinChart RSI is still falling gradually below 50% level; this suggests that the FBMACE is indeed loosing strength. If the WinChart RSI should break below 30% level, it would be a mid term bearish signal for the FBMACE.
AS circled at C, the Stochastic is still below 10%, which is a short term over-sold region. This suggests that the FBMACE is likely to have a technical rebound in the near term. However, the technical rebound signal has to be confirmed by the Stochastic breaking above 30% level.
In short, after falling for more than a week, the FBMACE is turning weaker. The outlook for the FBMACE shall remains bearish biased if the FBMACE should remains resisted by the falling 14, 21, 31 EMA. Technically, all rebound below the dynamic resistance are considered technical rebound, not a signal of a reversal.
Find this analysis useful? Why not share it with others? Click Here to send this to a friend
 1st Online Training In Malaysia |
 |
 |
 |
| View the Online Training | More Market Analysis | Find out more about WinChart | Upcoming Events |
Straits Index (M)
Sdn Bhd
No. 16, Jalan LP 1A / 5, Lestari Perdana,
43300 Seri Kembangan, Selangor
Hotline: (03) 8941 6828 (5
lines) Fax: (03) 8941 9828
Email: info@straitsindex.com
© Copyright 1997-2010 Straits Index (M) Sdn Bhd All
rights reserved